설명
테이프 리딩 인디케이터: 실시간으로 주문 흐름에 기반한 리딩.
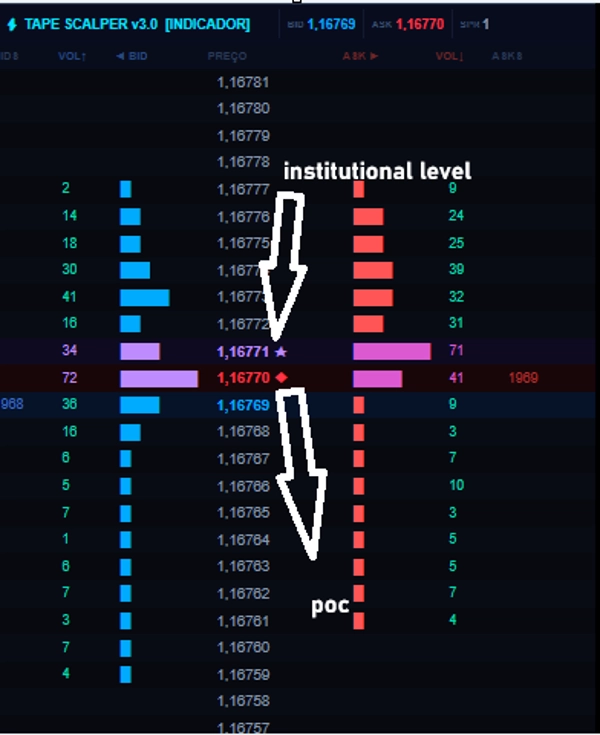
가격선별 정보:
가격: 가격 수준의 정확한 값.
VOL↑ 및 VOL↓: 분석 창 내에서 해당 가격에서 발생한 공격적 틱(매수 또는 매도)의 원시 숫자.
바(◄ BID 및 ASK ►): 볼륨의 시각적 비교를 용이하게 하는 가변 너비 바. 바가 넓을수록 볼륨이 큼.
BIDS / ASKS (시뮬레이션): 현재 가격을 기반으로 유동성을 시뮬레이션하기 위해 인디케이터가 생성한 값.
시각적 하이라이트: 코드는 중요한 이벤트에 대해 특별한 색상과 기호를 적용합니다:
현재 가격 (BID/ASK): 매수 가격선은 진한 파란색으로, 매도 가격선은 진한 빨간색으로 변함.
◆ (다이아몬드): POC(포인트 오브 컨트롤) 표시 – 기간 내 누적 볼륨이 가장 높은 가격 수준.
★ (별): 해당 수준의 볼륨이 기관(설정된 임계값 이상)임을 나타냄.
← (화살표): 현재 가격이 브레이크아웃 전략에 정의된 범위(상단 또는 하단)의 한계에 있음을 나타냄.
바 및 숫자 색상:
시안 / 연한 파랑: 일반 매수 볼륨.
빨강 / 분홍: 일반 매도 볼륨.
초록 / 노랑: 예외적으로 높은 볼륨(HiVol).
보라 / 연보라: 기관으로 분류된 볼륨.
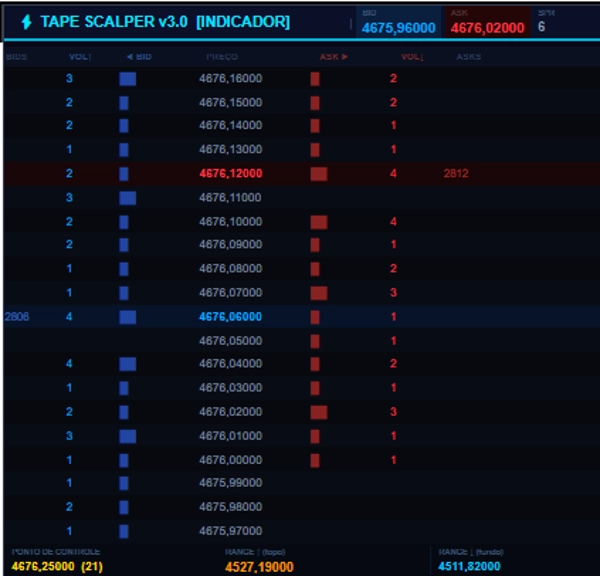
4. STATSROW (하단 통계선)
테이프 리딩 분석을 위한 세 가지 중요한 맥락 지표를 표시합니다.
지표 코드명 의미
포인트 오브 컨트롤 POC 총 누적 볼륨(매수 및 매도 합계)이 가장 높은 가격 수준. 가격과 총 볼륨 표시
RANGE↑ (상단) 범위 최고 바 기간(예: 최근 20개 바)으로 정의된 범위 내 최고 가격.
RANGE↓ (하단) 범위 최저 바 기간으로 정의된 범위 내 최저 가격.
판매 포트폴리오 요약
이 인디케이터를 제품으로 소개할 때 대시보드에서만 독점적으로 볼 수 있는 다음 정보를 강조해야 합니다:
실시간 주문 흐름 시각화: 매수자와 매도자의 레벨별 전투를 확인하세요.
기관 수준 식별 (★): 가격 사다리에서 직접 "스마트 머니"와 소매를 구분.
동적 포인트 오브 컨트롤 (POC) (◆): 현재 볼륨이 집중된 위치를 정확히 파악.
시각적 브레이크아웃 감지 (←): 가격이 미리 정의된 범위의 가장자리에 닿았을 때 사다리에서 직접 확인.
프로 버전을 사용해 보세요: https://ctrader.com/products/4282
요약
Key features include simulated bid and ask liquidity values, visual highlights for important events, and color-coded volume bars: cyan/light blue for normal buy volume, red/pink for normal sell volume, green/yellow for exceptionally high volume, and purple/lilac for institutional volume. Special symbols mark the Point of Control (◆) representing the price level with the highest accumulated volume, institutional volume levels (★), and breakout range limits (←).
A lower statistics row provides contextual metrics such as the Point of Control (POC), Range High (RANGE↑), and Range Low (RANGE↓) over the selected bar period. The indicator supports visualization of institutional activity and breakout detection directly on the price ladder, aiding in detailed tape reading and volume-based market analysis. It requires tick data and outputs visual signals including level touches, breaks, and reversals.