
설명
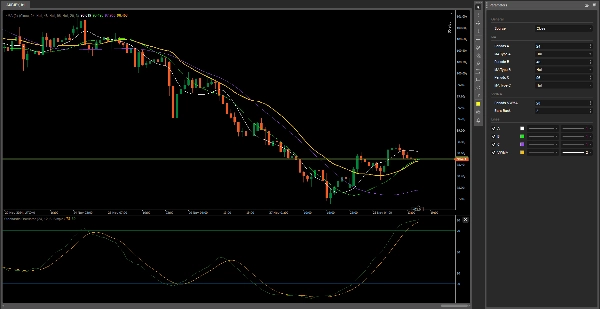
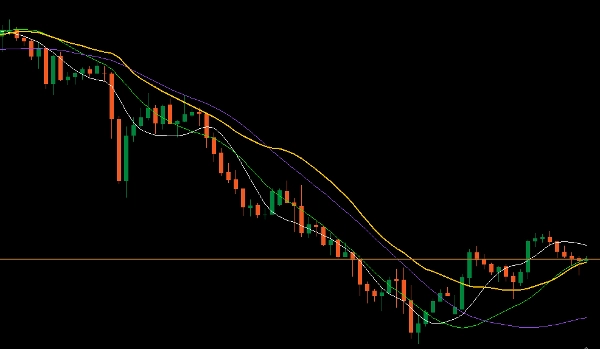
이 지표는 이동 평균 3개로 구성되어 있으며, 이동 평균 유형부터 색상, 두께, 선 유형까지 원하는 대로 설정할 수 있습니다.
네 번째는 VWMA(거래량 가중 이동 평균)입니다 – 이 지표의 일반적인 공식은 - 3일 VWMA = (C1 * V1 + C2 * V2 + C3 * V3) / (V1 + V2 + V3)입니다.
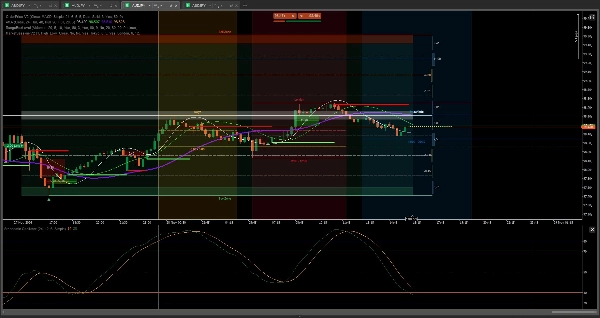
이 옵션에서는 간격을 3번뿐만 아니라 최대 500번까지 반복할 수 있는 기능을 만들었습니다.
차트를 깔끔하게 유지하기 위해 이 기능을 만들었습니다.
기본 매개변수는 완벽한 이동 평균 헐이며, 각 시간 프레임에서 24, 48, 96 기간이 저에게 더 최적입니다.
추가
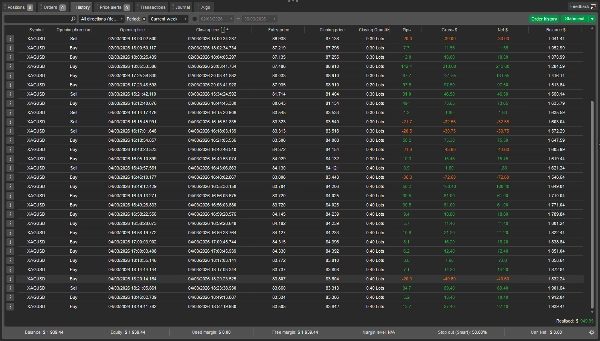
이것들은 제가 돈을 버는 데 도움이 되는 도구들입니다
https://ctrader.com/products/3441?u=Thomas-Sparrow
https://ctrader.com/products/526?u=Thomas-Sparrow
https://ctrader.com/products/3137?u=Thomas-Sparrow
https://ctrader.com/products/2913?u=Thomas-Sparrow
당신은 무적이 될 것입니다
행운을 빕니다 😀
요약
지표 프로필
고객 리뷰
5.0
리뷰: 1
5 | 100 % | |
4 | 0 % | |
3 | 0 % | |
2 | 0 % | |
1 | 0 % |
고객 리뷰
August 12, 2025
Pros: Displays up to four moving averages with full customization. Clean visualization and stable performance. Cons: No alerts or tooltips. Doesn’t support saving user templates. Lacks built-in crossover notifications.
상담
자주 묻는 질문(FAQ)
Prop
Forex
Indices
Commodities
Crypto
Stocks
트레이딩 봇, 지표, 플러그인 등 cTrader Store에서 제공되는 상품은 제3자 개발자에 의해 제공되며, 이는 단순히 정보 및 기술적 접근을 목적으로 제공된 것입니다. cTrader Store는 중개인이 아니며, 투자 조언, 개인별 추천 또는 향후 성과에 대한 어떠한 보장도 제공하지 않습니다.
이 작성자의 상품 더 보기


가격
147
판매
11.17K
무료 설치