
설명
LTtradingBox란?
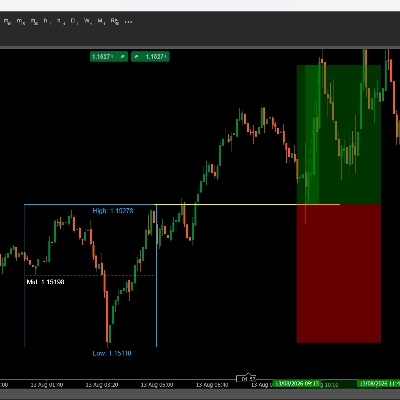
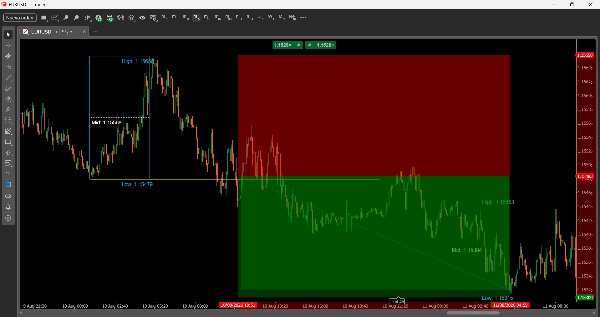
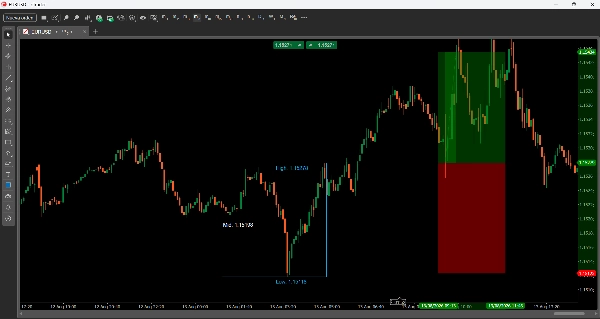
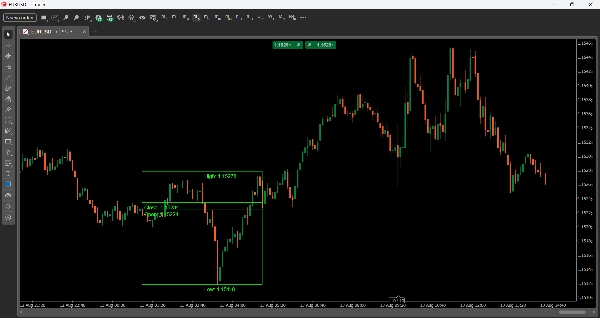
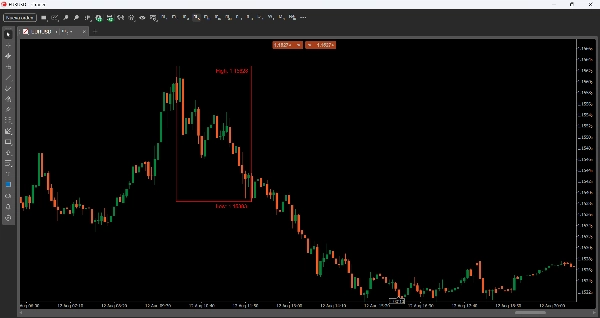
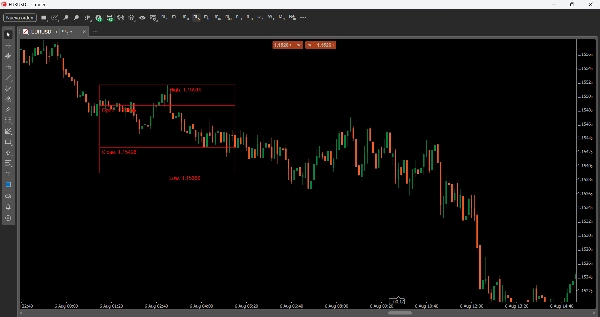
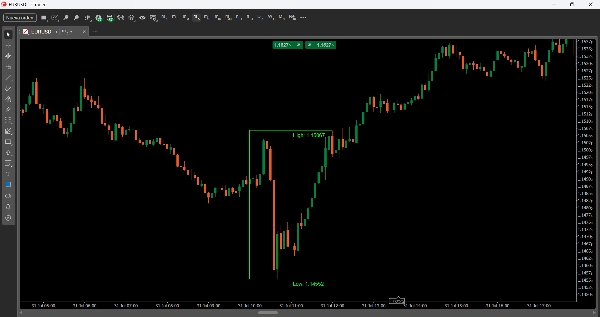
LTtradingBox는 사용자가 정의한 시간 창(예: 런던 또는 뉴욕 세션)의 가격 범위(고가, 저가, 시가, 종가)를 시각적으로 표시합니다. 박스는 해당 세션의 결과에 따라 자동으로 색상이 변경됩니다: 강세로 마감되면 녹색, 약세로 마감되면 빨간색, 중립일 경우 회색(또는 각 경우에 선택한 색상). 또한 기준선(중간 가격, 중간 시간)과 선택적 시각적 채우기를 추가하여 유동성 구역, 축적 범위 및 주요 거래 레벨을 한눈에 파악할 수 있도록 도와줍니다.
매개변수
시간 설정
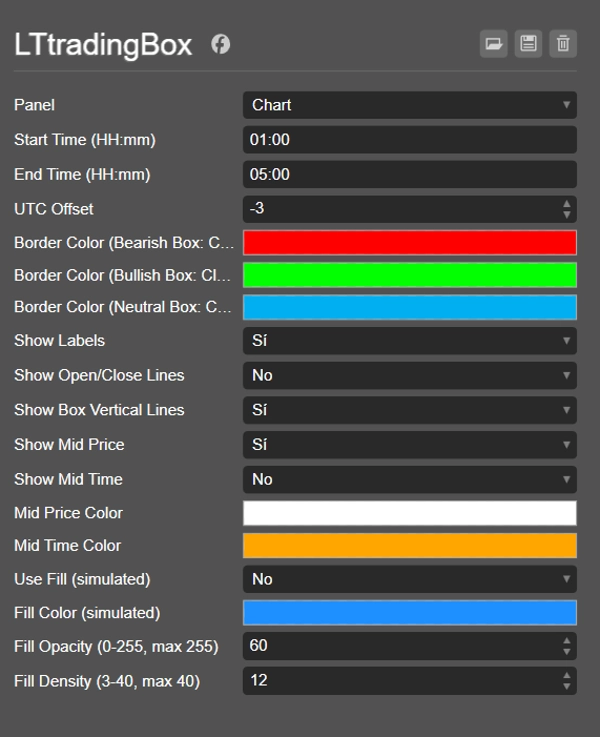
- 시작 시간 (HH:mm) — 박스의 시작 시간(24시간 형식).
- 종료 시간 (HH:mm) — 박스의 종료 시간.
- UTC 오프셋 — 브로커의 시간대와 관계없이 박스가 현지 시간 또는 추적하려는 세션(예: 런던, 뉴욕, 아시아)에 맞도록 시간 조정.
색상
- 테두리 색상 (약세 박스: 종가 < 시가) — 박스가 약세로 마감될 때의 테두리 색상.
- 테두리 색상 (강세 박스: 종가 > 시가) — 박스가 강세로 마감될 때의 테두리 색상.
- 테두리 색상 (중립 박스: 종가 == 시가) — 종가와 시가가 같을 때의 테두리 색상.
표시 옵션
- 레이블 표시 — 고가, 저가, 시가, 종가 값을 보여주는 텍스트 레이블을 토글합니다.
- 시가/종가 선 표시 — 박스 내 시가와 종가 가격을 표시하는 수평선을 그립니다.
- 박스 세로선 표시 — 전체 사각형(4개의 테두리)을 활성화합니다; 비활성화하면 고가와 저가 선만 표시됩니다.
- 중간 가격 표시 — 고가와 저가의 중간 지점에 점선으로 표시합니다.
- 중간 시간 표시 — 박스 시간의 중간 지점에 수직선을 그립니다.
- 중간 가격 색상 / 중간 시간 색상 — 해당 선들의 색상을 사용자 지정할 수 있습니다.
채우기 (시각적 채우기)
- 채우기 사용 (시뮬레이션) — 박스 내부에 시뮬레이션된 채우기(겹쳐진 얇은 선 사용)를 활성화합니다.
- 채우기 색상 (시뮬레이션) — 채우기 색상.
- 채우기 불투명도 (0-255, 최대 255) — 채우기의 투명도 수준.
- 채우기 밀도 (3-40, 최대 40) — 채우기를 시뮬레이션하는 데 사용되는 선의 수(밀도가 높을수록 더 단단한 채우기).
거래 아이디어
- 돌파 및 재시험: 가격이 박스의 고가 또는 저가를 돌파한 후, 그 수준을 지지/저항으로 재시험할 때까지 기다렸다가 돌파 방향으로 진입합니다.
- 극단에서의 반전: 가격이 박스의 고가 또는 저가에 닿았지만 강하게 돌파하지 못하면, 반전 신호일 수 있으며 박스의 반대쪽으로 움직일 가능성이 있습니다.
- 세션별 방향성 편향: 박스의 색상은 해당 세션의 움직임에 대한 빠른 편향(강세/약세/중립)을 제공하며, 이후 세션에서 진입을 조율하는 데 유용합니다.
- 중간 가격을 자석으로 활용: 중간 지점은 종종 균형 조정 구역으로 작용하므로, 강한 충동 움직임 후 가격이 중간으로 돌아올 때 진입을 모색합니다.
- 연속 박스 비교: 각 일일 박스가 날짜 태그를 통해 저장되므로, 여러 연속 세션의 범위와 편향을 비교하여 단기 추세를 파악할 수 있습니다.
요약
AI 요약
LTtradingBox is a customizable trading indicator that visually highlights the price range—high, low, open, and close—within any user-defined time window, such as a specific trading session. The indicator draws a colored box representing this range, automatically changing its border color to green for bullish closes, red for bearish closes, or gray for neutral, with customizable color options. It includes reference lines for the midpoint price and midpoint time, which can be displayed as dotted or vertical lines, aiding in identifying liquidity zones, accumulation areas, and key support/resistance levels.
Users can configure start and end times, apply a UTC offset to align with local or session times, and toggle display options such as labels for price points, open/close lines, full box borders, and visual fills with adjustable color, opacity, and density. The indicator supports trading strategies including breakout and retest of box boundaries, reversal signals at extremes, session-based directional bias, and using the midpoint as a rebalancing zone. It also allows comparison of consecutive session boxes to detect short-term trends. LTtradingBox is designed to assist traders in quickly identifying key levels and market structure within chosen timeframes.
Users can configure start and end times, apply a UTC offset to align with local or session times, and toggle display options such as labels for price points, open/close lines, full box borders, and visual fills with adjustable color, opacity, and density. The indicator supports trading strategies including breakout and retest of box boundaries, reversal signals at extremes, session-based directional bias, and using the midpoint as a rebalancing zone. It also allows comparison of consecutive session boxes to detect short-term trends. LTtradingBox is designed to assist traders in quickly identifying key levels and market structure within chosen timeframes.
지표 프로필
지표 카테고리
지지 및 저항
출력 유형
시각화
데이터 요구 사항
막대만
지원되는 신호
돌파
반전
레벨 돌파
레벨 터치
고객 리뷰
0.0
리뷰: 0
고객 리뷰
이 상품에 대한 리뷰가 아직 없습니다. 이미 사용해 보셨나요? 다른 사람들에게 가장 먼저 소개해 주세요!
상담
자주 묻는 질문(FAQ)
Key Levels
Support & Resistance
트레이딩 봇, 지표, 플러그인 등 cTrader Store에서 제공되는 상품은 제3자 개발자에 의해 제공되며, 이는 단순히 정보 및 기술적 접근을 목적으로 제공된 것입니다. cTrader Store는 중개인이 아니며, 투자 조언, 개인별 추천 또는 향후 성과에 대한 어떠한 보장도 제공하지 않습니다.


















가격
가입일 10/01/2025