
説明
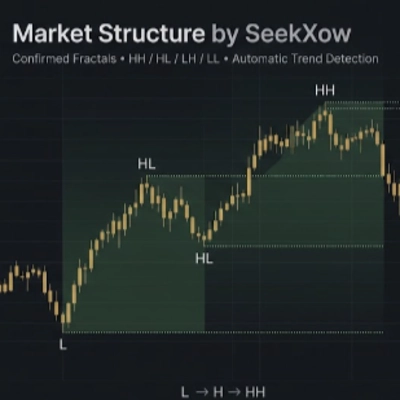
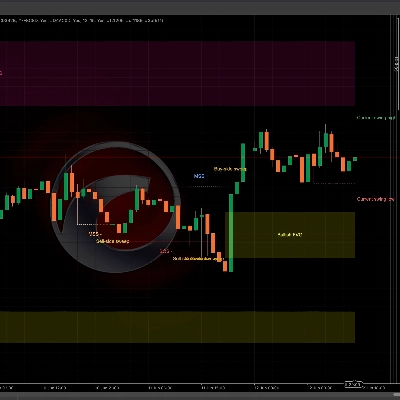
確認されたフラクタルピボットを使用して市場構造を識別および視覚化するために設計されたプライスアクションインジケーター。このインジケーターはスイングの高値と安値を追跡し、それらを以下に分類します:
- HH — ハイアーハイ
- HL — ハイアーロー
- LH — ローワーハイ
- LL — ローワーロー
確認されたフラクタルピボットを使用してノイズを減らし、未確認の価格変動に依存することを避けます。同じタイプの連続するピボットは圧縮され、市場構造が評価される前に関連する極値が保持されます。
主な特徴
- 確認されたフラクタルベースのスイング検出
- 自動HH / HL / LH / LL分類
- 強気および弱気の市場構造検出
- 自動トレンド状態識別
- 視覚的な水平構造レベル
- トレンド背景の視覚化
- 新しい確認されたピボットが発生するにつれて構造が適応
- 裁量的なプライスアクションおよび市場構造分析のために設計
動作方法
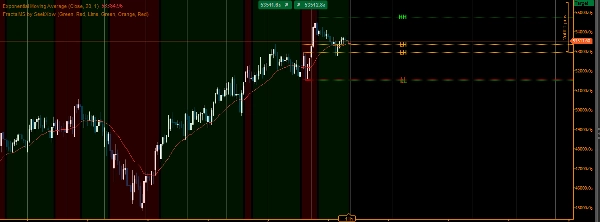
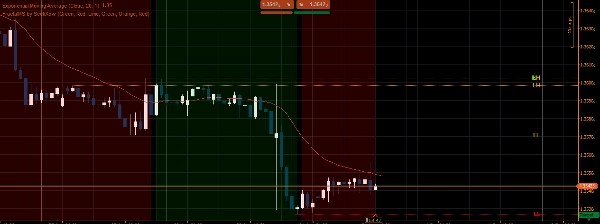
このインジケーターは最初に確認されたスイングの高値と安値を検出します。これらのピボットは次に高値と安値が交互に並ぶシーケンスに処理されます。得られたピボットシーケンスは現在の市場構造とトレンドを判断するために使用されます。上昇トレンド中は、新しい高値がハイアーハイを形成し、関連する押し目の安値がハイアーローとなります。下降トレンド中は逆のロジックが適用されます。関連する構造レベルの突破は検出されたトレンドの変化を引き起こす可能性があります。
使用目的
このインジケーターは、プライスアクション、サポート/レジスタンス、流動性分析、またはその他のテクニカルツールと並行して市場構造のレイヤーとして使用できます。異なる時間枠でのスイング構造のよりクリーンな視覚表現を求めるトレーダーに適しています。
注意: このインジケーターはテクニカル分析ツールであり、金融アドバイスや取引結果の保証を提供するものではありません。
概要
AIによる概要
FractalMS by SeekXow is a price-action indicator that identifies and visualizes market structure using confirmed fractal pivots. It detects swing highs and lows and classifies them into four pivot types: Higher High (HH), Higher Low (HL), Lower High (LH), and Lower Low (LL). By relying on confirmed fractal pivots, the indicator reduces noise and avoids repainting, compressing consecutive pivots of the same type to retain relevant extremes before evaluating market structure.
Key features include automatic classification of pivot types, bullish and bearish market structure detection, trend-state identification, visual horizontal structure levels, and trend background visualization. The indicator continuously adapts as new confirmed pivots develop.
FractalMS works by detecting confirmed swing highs and lows, processing them into an alternating sequence to determine current market structure and trend. During uptrends, it identifies higher highs and higher lows; during downtrends, it identifies lower highs and lower lows. Breaking structural levels signals potential trend changes.
Designed for discretionary price-action and market-structure analysis, this tool supports traders seeking a clearer visual representation of swing structure across multiple timeframes. It complements other technical tools such as support/resistance and liquidity analysis.
インジケーターのプロフィール
インジケーターのカテゴリー
市場構造(SMC)
出力の種類
ビジュアル表示
データ要件
バーのみ
サポート対象のシグナル
ブレイクアウト
トレンドの強さ
ラインブレイク
反転
ラインタッチ
ディスカッション
カスタマーレビュー
0.0
レビュー: 0
カスタマーレビュー
この商品にはまだレビューがありません。お使いになったことがある方は、ぜひレビューをお願いします。
よくあるご質問
Key Levels
MSS
Market Structure
Support & Resistance
cTrader Storeで入手可能な取引ボット、インジケーター、プラグインなどの商品は、第三者の開発者が提供するものであり、情報と技術の取得のみを目的としてご利用いただけます。cTrader Storeはブローカーではなく、投資助言や個人的な推奨を行うことも、将来のパフォーマンスを保証することもありません。
この作成者の他の商品








価格
登録日 09/12/2025
8.14M
取引数量
16.34K
獲得pips