
Penerangan
Penunjuk Masa Untuk Pulang Modal v2
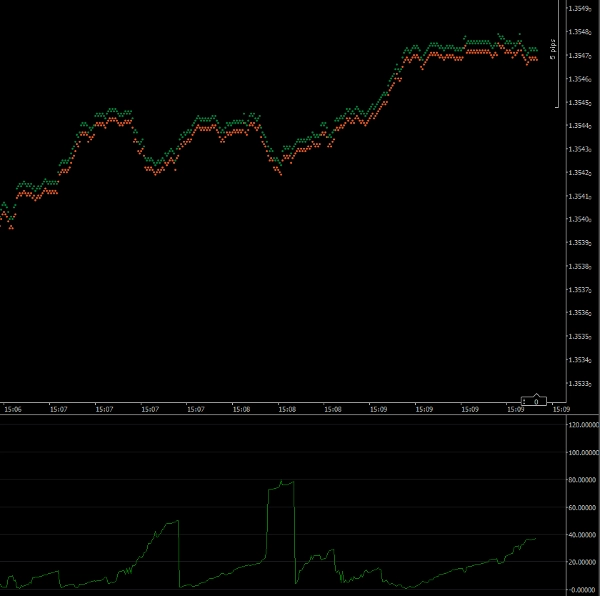
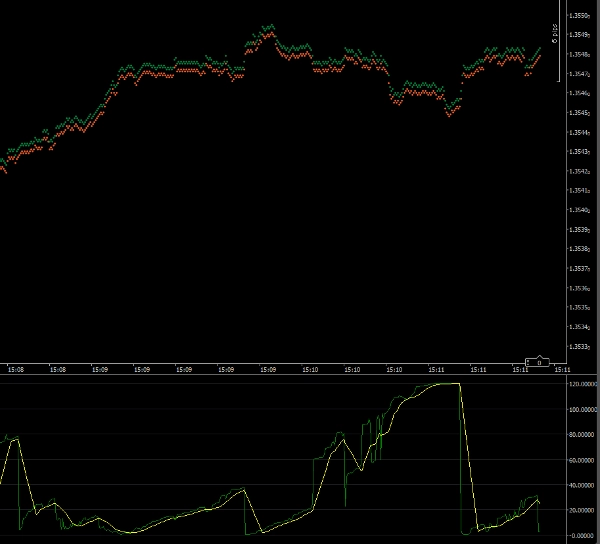
Penunjuk ini akan membantu anda menentukan masa masuk dagangan anda ke dalam pasaran. Plot menunjukkan anggaran bilangan saat untuk dagangan anda mencapai pulang modal. Jika pasaran bergerak pantas dan mengikut arah anda, penunjuk akan memberikan nombor yang kecil. Jika pasaran bergerak bertentangan dengan anda atau perlahan, nombor akan menjadi lebih besar.
Penunjuk mengira bilangan pip yang diperlukan oleh dagangan anda untuk mencapai pulang modal. Ia kemudian membandingkan ini dengan kelajuan semasa harga bergerak.
N.B. Penunjuk ini harus dijalankan pada Rangka Masa 1 Tick.
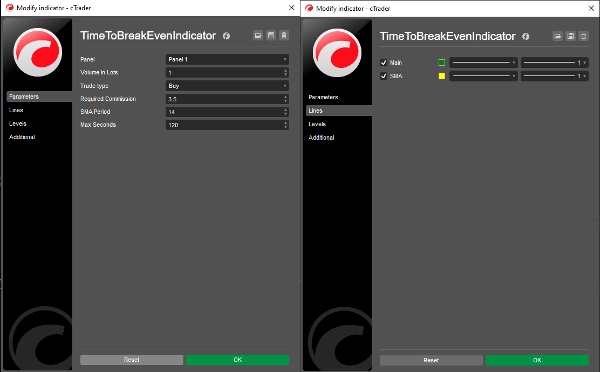
Parameter
Isipadu dalam Lot: Isipadu dagangan yang dicadangkan
Jenis Dagangan: Sama ada dagangan anda adalah untuk beli atau jual
Komisen Diperlukan: Komisen yang akan dikenakan pada dagangan anda (anda boleh dapatkan ini dari tetingkap Dagangan Pantas)
Tempoh SMA: Tempoh plot Purata Pergerakan Mudah (default = 14)
Maks Saat: Bilangan maksimum saat yang akan direkodkan (lihat di bawah)
Garis
Utama: Garis plot penunjuk (default = hijau)
SMA: Garis plot Purata Pergerakan Mudah (default = kuning)
Maks Saat
Membenarkan penunjuk memaparkan nilai yang sangat besar bermakna skala penunjuk akan menghalang anda daripada melihat butiran apabila masa untuk pulang modal adalah kecil. Menetapkan parameter ini membolehkan anda menetapkan skala maksimum penunjuk. Secara lalai ia ditetapkan kepada 120 (2 minit). Jadi sebarang output 2 minit atau lebih akan diplot sebagai 120 saat.
Dr Andy Larkin
Hak Cipta 2025, Semua Hak Terpelihara
26 Mei 2025
Undang-Undang
Keputusan daripada penunjuk ini harus diperiksa ketepatannya sebelum digunakan dalam dagangan langsung.
Tiada jaminan diberikan atau tersirat untuk keputusan penunjuk ini.
Tiada liabiliti diterima untuk sebarang kerugian yang ditanggung akibat menggunakan penunjuk ini.
Ringkasan
Ulasan pelanggan
5 | 50 % | |
4 | 50 % | |
3 | 0 % | |
2 | 0 % | |
1 | 0 % |


