
Penerangan
Penunjuk ini mengenal pasti zon kecairan dan blok pesanan di pasaran, mengikut konsep dari Teori Pasaran Wang Pintar (ICT/SMC).
https://ctrader.com/pt/products/1560
https://ctrader.com/pt/products/1386
Penunjuk beroperasi dalam empat langkah utama:
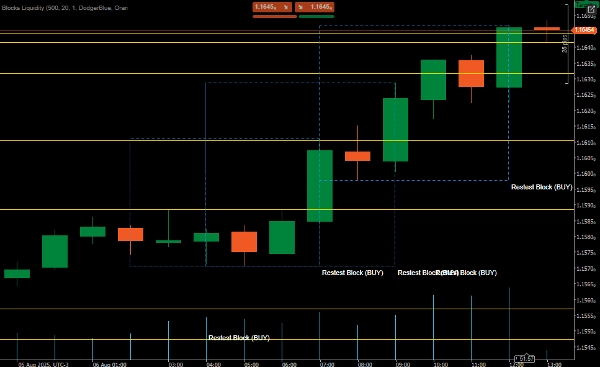
✅Pengenalpastian Blok Pesanan
Mengesan pergerakan impulsif (minimum 20 pips secara lalai)
Mencari zon pengukuhan sebelum impuls
Mengklasifikasikan sebagai blok beli atau jual
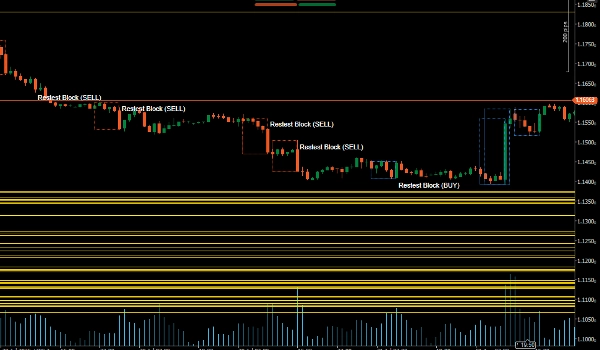
✅Pengenalpastian Kolam Kecairan
Menandakan paras tinggi dan rendah terkini sebagai zon kecairan
Kawasan ini mewakili sasaran atau titik berhenti yang berpotensi
✅Pengesahan Ujian Semula
Memeriksa apabila harga kembali ke blok pesanan
Mengesahkan dengan corak pembalikan (Pin Bar/Engulfing) dan volum
✅Visualisasi Carta
Melukis blok pesanan dan zon kecairan
Mengeluarkan amaran bunyi apabila pengesahan berlaku
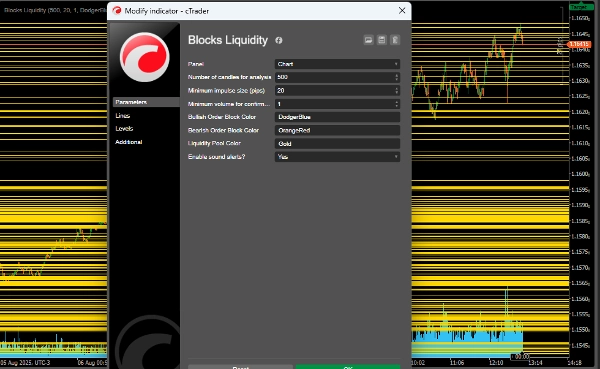
✅Parameter Boleh Konfigurasi
LookbackPeriod: Bilangan lilin untuk dianalisis (500 secara lalai)
MinImpulsePips: Saiz minimum pergerakan impulsif (20 pips)
MinVolumeThreshold: Volum minimum untuk pengesahan (1.0)
Warna boleh disesuaikan untuk blok bullish/bearish dan zon kecairan
Pilihan amaran bunyi
✅Logik Perdagangan
Blok bullish (beli):
Terbentuk selepas pengukuhan dan momentum ke atas
Zon sokongan berpotensi
Masuk disahkan oleh corak pembalikan + volum pada ujian semula
Blok bearish (jual):
Terbentuk selepas pengukuhan dan momentum ke bawah
Zon rintangan berpotensi
Masuk disahkan dengan cara yang sama
✅Kolam Kecairan:
Paras tinggi/rendah terkini sebagai sasaran atau hentian
Kawasan di mana kemungkinan terdapat tumpuan pesanan hentian
Ringkasan
Key features include:
- Order Block Identification: Detects bullish and bearish blocks formed after consolidation and momentum shifts, serving as potential support or resistance zones.
- Liquidity Pool Identification: Highlights recent highs and lows that may act as targets or stop areas due to stop order concentration.
- Retest Confirmation: Validates entries by checking price returns to order blocks combined with reversal candlestick patterns (Pin Bar, Engulfing) and volume thresholds.
- Chart Visualization: Draws order blocks and liquidity zones with customizable colors and provides sound alerts upon confirmation.
- Configurable parameters such as lookback period, minimum impulse size, and volume threshold allow adaptation to different trading preferences.
This indicator supports analysis of price action dynamics to assist traders in identifying key market levels and potential trade entry points.
Ulasan pelanggan
5 | 100 % | |
4 | 0 % | |
3 | 0 % | |
2 | 0 % | |
1 | 0 % |


