DEnvelopSystem
Indikator
Versi 1.0, Aug 2025
Windows, Mac
5.0
Ulasan: 1
Penerangan
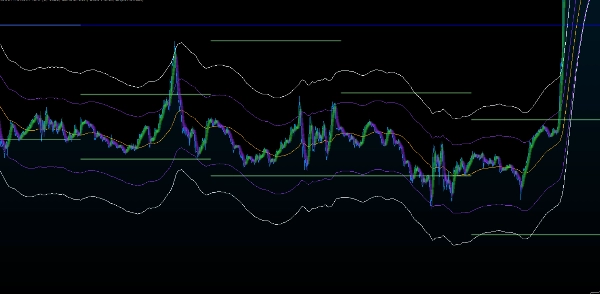
📈 DEnvelopSystem — Ketepatan Sampul Masa Dua
DEnvelopSystem adalah petunjuk perdagangan berprestasi tinggi yang direka untuk scalper dan ahli strategi intrahari yang menuntut ketepatan, kebolehsuaian, dan konfluens. Direka untuk beroperasi dengan lancar merentasi jangka masa 1–5 minit, alat ini menggabungkan dua sampul purata bergerak dari dua jangka masa berbeza, menawarkan rangka kerja dinamik untuk kedua-dua strategi mengikuti tren dan pembalikan purata.
🔧 Ciri Utama
- Gabungan Sampul Masa Dua
Tindih sampul dari dua jangka masa untuk menangkap volatiliti jangka pendek dalam pergerakan struktur yang lebih luas. Sesuai untuk mengenal pasti penarikan mikro dalam tren makro. - Penyimpangan Harga Peratusan Tersuai
Laraskan kepekaan sampul dengan ambang peratusan yang boleh dilaras, membolehkan pedagang menentukan jalur volatiliti dan zon pecahan mereka sendiri. - Visualisasi Lima Garis
Memaparkan sejumlah lima garis: dua had atas, dua had bawah, dan purata bergerak tengah — mencipta peta visual yang jelas tentang tingkah laku harga dan zon mampatan. - Zon Konfluens Berwarna
Pewarnaan tersuai menyerlahkan kawasan utama pertindihan dan perbezaan, menjadikan zon kemasukan berkemungkinan tinggi mudah dikenali. - Sinergi Tren & Pembalikan
Sama ada anda mengikuti momentum atau mengurangkan ekstrem, DEnvelopSystem menyesuaikan dengan strategi anda — menawarkan isyarat boleh dipercayai untuk kedua-dua tetapan pecahan dan pantulan
🎯 Kenapa Pedagang Menyukainya
- Alat Konfluens Teras: Berfungsi sebagai sauh visual untuk tetapan pelbagai petunjuk, membantu mengesahkan kemasukan dengan ketepatan.
- Dioptimumkan untuk Scalping: Dibina untuk persekitaran berkelajuan tinggi di mana masa dan kejelasan adalah segalanya.
- Penguasaan Kemasukan: Menentukan zon di mana harga berinteraksi dengan sempadan sampul merentasi jangka masa — sesuai untuk kemasukan gaya penembak tepat dan penempatan hentian ketat.
Ringkasan
Profil indikator
Ulasan pelanggan
5.0
Ulasan: 1
5 | 100 % | |
4 | 0 % | |
3 | 0 % | |
2 | 0 % | |
1 | 0 % |
Perbincangan
Soalan Lazim
Produk yang tersedia melalui cTrader Store, termasuk bot dagangan, indikator dan plugin, disediakan oleh pembangun pihak ketiga dan diberikan akses untuk tujuan maklumat dan teknikal sahaja. cTrader Store bukan broker dan tidak memberikan nasihat pelaburan, syor peribadi atau sebarang jaminan prestasi masa hadapan.


Harga
25
Jualan
2.1K
Pemasangan percuma