Penerangan
Bounty Killa – penunjuk yang memburu kecairan stop-loss sebelum pemain besar melakukannya.
Bounty Killa adalah penunjuk cTrader yang direka untuk pedagang yang suka berdagang perburuan stop / tangkapan kecairan: lilin-lilin yang melonjak melebihi paras tertinggi atau di bawah paras terendah, membersihkan stop dan kemudian berbalik ke arah bertentangan.
Penunjuk ini secara automatik mengimbas setiap lilin dan menandakan:
- SHS (Stop Hunt High) – kemungkinan perburuan stop di atas paras tertinggi terkini → kawasan untuk mencari persediaan pendek
- SHL (Stop Hunt Low) – kemungkinan perburuan stop di bawah paras terendah terkini → kawasan untuk mencari persediaan panjang
Logik pengesanan dibina berdasarkan:
- memecahkan paras tertinggi/terendah terkini sekurang-kurangnya X pips,
- sebuah wick panjang yang melampaui paras itu,
- sebuah badan kecil dan penutupan dalam arah bertentangan dengan pecahan.
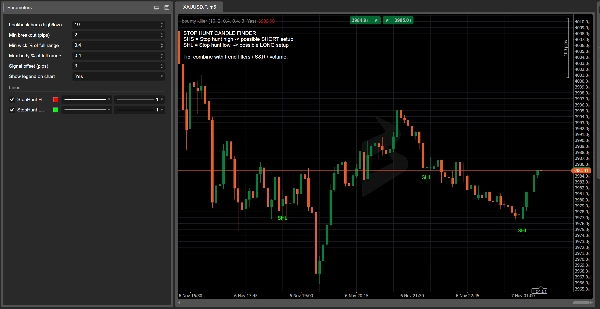
Tidak perlu lagi meneka “mungkin ini adalah perburuan stop”: Bounty Killer menonjolkan lilin utama terus pada carta anda, dengan label jelas, warna dan legenda pada carta.
Mengapa pedagang menyukainya:
- Menunjukkan di mana pasaran mungkin telah mengambil kecairan dan di mana pembalikan menjadi lebih bermakna.
- Sepenuhnya boleh disesuaikan: tetingkap tinjauan, pecahan minimum dalam pips, peratusan badan/wick, offset isyarat.
- Menggabungkan dengan sempurna dengan sokongan/rintangan klasik, bekalan & permintaan, volum, blok pesanan dan konsep SMC.
- Sesuai untuk pedagang yang mengikuti persediaan berasaskan kecairan tetapi mahukan sesuatu yang objektif dan berasaskan peraturan dan bukannya hanya meneka.
⚠️ Bounty Killa bukan sistem perdagangan penuh dan tidak membuka atau menutup dagangan.
Lilin yang ditandakan adalah zon maklumat tinggi yang harus digabungkan dengan strategi anda sendiri, analisis trend dan pengurusan risiko.
Bounty Killa – Panduan Pengguna Pantas (EN)
1. Pasaran & jangka masa yang disyorkan
- Jangka masa: H1, H4, D1
(TF lebih rendah seperti M1–M5 = banyak bunyi, gunakan terutamanya untuk kajian.) - Simbol: indeks, FX, kripto, saham, komoditi – di mana sahaja anda boleh memasang penunjuk cTrader.
2. Cara membaca isyarat
- SHS – Stop Hunt High (label merah di atas lilin)
-
- Harga melonjak di atas paras tertinggi terkini, menghasilkan wick atas panjang, dan tutup bearish.
- Idea: potensi persediaan pendek selepas pecahan palsu dan tangkapan kecairan di atas paras tertinggi.
- SHL – Stop Hunt Low (label hijau di bawah lilin)
-
- Harga melonjak di bawah paras terendah terkini, menghasilkan wick bawah panjang, dan tutup bullish.
- Idea: potensi persediaan panjang selepas pecahan palsu dan tangkapan kecairan di bawah paras terendah.
Bounty Killer tidak mengatakan “beli/jual sekarang”.
Ia menonjolkan zon kecairan di mana pembalikan lebih masuk akal.
3. Tetapan asas yang dicadangkan
Dalam parameter penunjuk:
- Bar tinjauan (tinggi/rendah):
10–20
→ berapa banyak bar untuk melihat kembali paras tertinggi/terendah terkini. - Pecahan minimum (pips):
5–15pips
→ jarak minimum melebihi tinggi/rendah untuk dikira sebagai perburuan stop. - Peratusan wick minimum dari julat penuh:
0.60–0.70
→ sekurang-kurangnya 60–70% lilin mesti menjadi wick dalam arah perburuan stop. - Peratusan badan maksimum dari julat penuh:
0.25–0.35
→ badan kecil berbanding dengan julat lilin keseluruhan. - Offset isyarat (pips):
3–5
→ hanya visual, menggerakkan label SHS/SHL sedikit jauh dari lilin.
4. Contoh strategi ringkas
Penapis trend (EMA 200):
- Tambah EMA 200 ke carta anda.
- Hanya pendek:
-
- Harga di bawah EMA 200
- Anda mendapat isyarat SHS (perburuan stop tinggi).
- Hanya panjang:
-
- Harga di atas EMA 200
- Anda mendapat isyarat SHL (perburuan stop rendah).
Idea kemasukan:
- Tunggu lilin perburuan stop ditutup.
- Masuk pada lilin seterusnya hanya jika harga mengesahkan:
-
- Untuk SHS: lilin seterusnya memecahkan rendah lilin SHS → pertimbangkan pendek.
- Untuk SHL: lilin seterusnya memecahkan tinggi lilin SHL → pertimbangkan panjang.
Stop loss:
- Untuk SHS (pendek) → SL hanya di atas tinggi lilin SHS.
- Untuk SHL (panjang) → SL hanya di bawah rendah lilin SHL.
Ambil keuntungan:
- Sasarkan sekurang-kurangnya 1:1.5 atau 1:2 R/R, atau
- Gunakan paras ayunan tinggi/rendah berdekatan, sokongan/rintangan atau zon bekalan/permintaan sebagai sasaran.
5. Nota keselamatan & senarai semak pantas
Sebelum menggunakan isyarat Bounty Killer, tanya:
- Trend?
Adakah isyarat selari dengan trend keseluruhan (EMA 200 / struktur pasaran)? - Paras?
Adakah perburuan stop berlaku pada paras yang bermakna (tinggi/rendah sebelumnya, S/R, tinggi/rendah sesi, dll.)? - Konteks?
Ada berita, pembukaan/penutupan sesi, lonjakan volatiliti? - Risiko?
Adakah saiz stop anda sesuai untuk pengurusan wang anda (peratus maksimum setiap dagangan)?
Jika 3–4 perkara ini sejajar, SHS/SHL dari Bounty Killa bukan sekadar “lilin yang bagus”, tetapi zon bernilai tinggi untuk membina idea dagangan di sekelilingnya.
Ringkasan
The detection criteria include a breakout beyond recent highs/lows by a configurable number of pips, a long wick extending beyond that level, a small candle body, and a close opposite to the breakout direction. Signals are displayed directly on the chart with clear labels and colors, supported by an on-chart legend.
Recommended for use on hourly to daily timeframes (H1, H4, D1) across various markets including forex, indices, cryptocurrencies, stocks, and commodities, Bounty Killa is fully customizable with parameters such as lookback period, minimum breakout size, wick and body proportions, and signal label offset.
The indicator highlights high-value liquidity zones to support trading decisions but does not execute trades. It is intended to be combined with other analysis tools like support/resistance, volume, order blocks, and trend filters (e.g., 200 EMA) for developing objective, rule-based liquidity-based trading setups.
Ulasan pelanggan
5 | 50 % | |
4 | 50 % | |
3 | 0 % | |
2 | 0 % | |
1 | 0 % |


![Logo "[Hamster-Coder] Moving Average MTF"](https://cdn.ctrader.com/image/webp/b11b98b1-194d-4b8e-b00e-d611826ad159_31226)


![Logo "[Hamster-Coder] Bollinger Bands"](https://cdn.ctrader.com/image/webp/21d8e5d6-fb11-4bac-b9ee-cd05c2b76804_30327)


