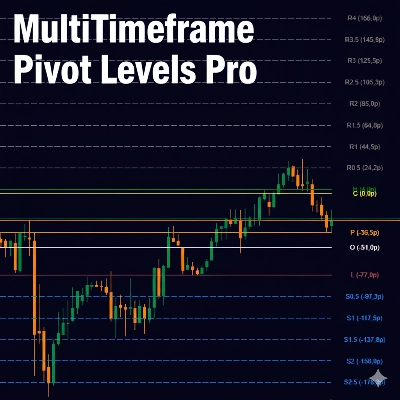
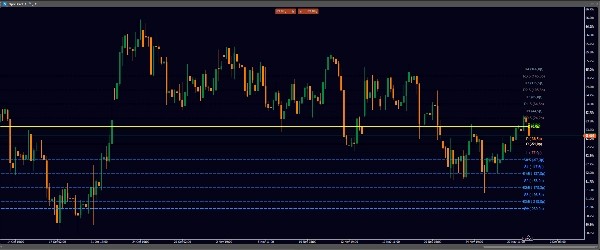
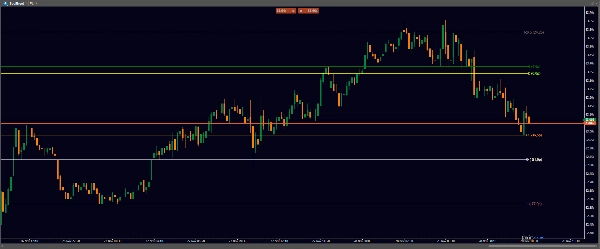
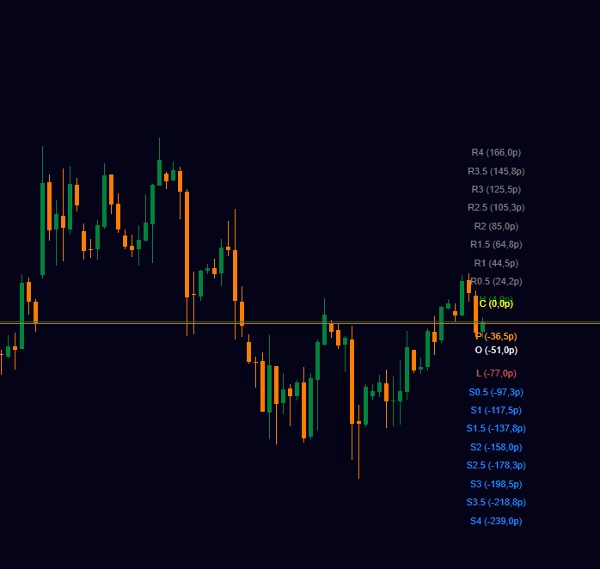
Logo "MultiTimeframe Pivot Levels Pro"
MultiTimeframe Pivot Levels Pro
Imej yang dimuat naik "MultiTimeframe Pivot Levels Pro"
Sejak 28/12/2024
41
Pemasangan percuma

MultiTimeframe Pivot Levels Pro is an advanced trading indicator that displays pivot points and support/resistance levels from higher timeframes directly on your current chart. This powerful tool helps traders identify key price levels for strategic entry and exit points.

Key Features:

  • Multi-timeframe analysis (display Daily, Weekly, Monthly pivots on any chart)
  • 8 support and 8 resistance levels for comprehensive market structure
  • Two pivot calculation methods (Classic: H+L/2, Standard: H+L+C/3)
  • Customizable colors and visibility for all levels
  • Distance display in pips from current price
  • Optimized performance for smooth operation
  • Clean, professional visual presentation

Perfect For:

  • Swing traders using multiple timeframes
  • Day traders needing key reference levels
  • Price action traders identifying support/resistance
  • All trading styles seeking precise level-based trading
Indicator profile
0.0
Ulasan: 0
Ulasan pelanggan
Belum ada ulasan untuk produk ini. Anda sudah mencuba produk tersebut? Jadilah yang pertama untuk berkongsi pendapat anda!
BTCUSD
Forex
Indices
EURUSD
Commodities
GBPUSD
NZDUSD
Crypto
Stocks
XAUUSD
NAS100
USDJPY
Products available through cTrader Store, including trading bots, indicators and plugins, are provided by third-party developers and made available for informational and technical access purposes only. cTrader Store is not a broker and does not provide investment advice, personal recommendations or any guarantee of future performance.

Lebih banyak produk daripada penulis ini

VWAP multi-timeframe + adaptive ATR bands + divergence + exhaustion and trend signals.

Anda juga mungkin suka

Bayesian theory** to forecast a future price while providing **uncertainty ranges** that represent upper and lower bound
Draws support and resistance on all pairs.
RCS: 8 majors! AUD,USD,EUR,JPY,GBP,CAD,CHF,NZD. Find how strong each currency is relatively and trade smarter!
🎯Identify zones of HIGH INSTITUTIONAL INTEREST: Where there is MORE VOLUME in the breaks, there is GREATER PARTICIPAT..
Institutional Flow Radar scans the chart for abnormal volume events and classifies them into two groups: Capital &Public
Stochastic Confluence Pro (RSI + Divergence)
🔮Channel Price Predictor: Anticipates future price zones with trend channels based on volatility and projections." 📈
Logo "IR Candle MTF"
4.6
(5)
Percuma
with this indicator you could see other time frame candle in your chart.
Customize your Moving Average! Choose any timeframe and price source for precision and flexibility in your analysis.
Support and Resistance.
Trend-following indicator with dynamic ATR-based trailing stop for precise entry/exit signals
Squeeze Momentum - Anticipate explosive market moves before they happen
Clean 3D, Sleek Candles for Trend Patterns.
This indicator tracks the unrealised amount of pips in your open positions.
Highlights market sessions & overlaps with real-time range & volume stats – perfect for pro scalpers.
It identifies areas of market imbalance (Fair Value Gaps or FVGs) and projects them on the chart in a smart way
Logo "TSPivotSMC"
4.0
(2)
$ 19
Pivot Point MultiTimeFrame with Order Block
Bring the RMA to cTrader! This is the Relative Moving Average from TradingView.
Sejak 28/12/2024
41
Pemasangan percuma