Penerangan
📊 Penunjuk Delta Isipadu Fib (PERCUMA)
Fibonacci, Unjuran & Delta Isipadu Sebenar untuk cTrader
🆓 Penunjuk Delta Isipadu Fib adalah penunjuk profesional percuma untuk cTrader, direka untuk membantu pedagang menganalisis retracement Fibonacci, struktur pasaran, dan delta isipadu sebenar dengan cara yang bersih dan intuitif.
Penunjuk ini adalah asas kepada Fib Volume Delta Bot, menyediakan logik yang sama dalam bentuk manual, visual.
📌 Untuk Penunjuk (Analisis Manual)
Notis Alat Berkaitan
Penunjuk ini adalah asas analitik kepada Fib Volume Delta Bot, satu penyelesaian perdagangan automatik yang dibina berdasarkan logik Fibonacci dan delta isipadu yang sama.Walaupun penunjuk ini direka untuk analisis manual dan sokongan keputusan, cBot mengubah logik ini menjadi strategi automatik sepenuhnya dengan pengurusan risiko dan perdagangan yang maju. https://ctrader.com/it/products//3006/?u=Labot
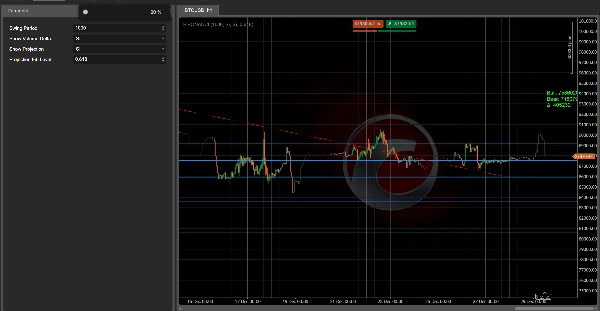
🔍 APA YANG DILAKUKAN PENUNJUK
Penunjuk secara automatik:
✅ Mengesan puncak ayunan & dasar ayunan
✅ Melukis tahap Fibonacci utama
✅ Mengira delta isipadu sebenar (isipadu tick lembu vs beruang)
✅ Meramalkan sasaran harga potensi menggunakan unjuran Fibonacci
✅ Berfungsi pada Forex, Kripto, Indeks
Tiada lukisan semula.
Tiada isipadu simulasi.
Tiada kekacauan.
🧮 CIRI UTAMA
📐 Struktur Fibonacci
- Pengesanan automatik julat harga semasa
- Tahap Fibonacci dilukis secara dinamik:
-
- 23.6%
- 38.2%
- 50.0%
- 61.8%
- 78.6%
- Logik bullish atau bearish berdasarkan urutan ayunan
🔮 Unjuran Fibonacci
- Pilihan garis unjuran untuk menganggarkan sasaran harga masa depan
- Menggunakan julat ayunan yang sama
- Sesuai untuk:
-
- perancangan ambil untung
- penilaian risiko/ganjaran
- analisis senario
📊 Delta Isipadu Sebenar
- Mengira isipadu tick bullish vs bearish
- Memaparkan:
-
- Isipadu lembu
- Isipadu beruang
- Delta (Lembu − Beruang)
- Membantu mengenal pasti:
-
- penyerapan
- divergen
- kekuatan atau kelemahan di sebalik pergerakan
⚠️ Menggunakan isipadu tick sebenar, bukan data simulasi.
⚙️ PENJELASAN PARAMETER
🧭 Pengesanan Ayunan
- 🔢 Tempoh Ayunan
-
- Bilangan bar yang digunakan untuk mengesan puncak ayunan dan dasar ayunan
- Nilai lebih tinggi = struktur lebih stabil
- Nilai lebih rendah = struktur lebih responsif
📊 Delta Isipadu
- 👁 Tunjukkan Delta Isipadu
-
- Dayakan / nyahdayakan teks delta isipadu pada carta
🔮 Unjuran
- 📈 Tunjukkan Unjuran
-
- Dayakan / nyahdayakan unjuran Fibonacci
- 📐 Tahap Unjuran Fib
🧠 CARA MENGGUNAKANNYA
✔ Kenal pasti zon retracement utama
✔ Sahkan kemasukan dengan delta isipadu
✔ Ramalkan sasaran yang realistik
✔ Gabungkan dengan tindakan harga atau penapis trend
✔ Sesuai untuk perdagangan manual atau aliran kerja separa automatik
🤖 ALIRAN KERJA PENUNJUK + BOT
Penunjuk ini adalah asas visual dan analitik kepada Fib Volume Delta Bot:
- 📊 Penunjuk → analisis & pengesahan
- ⚙️ cBot → pelaksanaan, pengurusan risiko & automasi
Anda boleh:
- menggunakan penunjuk sahaja (perdagangan manual)
- atau menggabungkannya dengan cBot untuk automasi penuh
🆓 PERCUMA & TRANSPARAN
✔ Sepenuhnya PERCUMA
✔ Tiada ciri terkunci
✔ Tiada kebergantungan luaran
✔ Direka untuk pedagang profesional
⚠️ PENAFIAN
Penunjuk ini tidak menjana isyarat sendiri.
Ia adalah alat sokongan keputusan, yang dimaksudkan untuk digunakan dengan pengurusan risiko yang betul dan konteks pasaran.
Ringkasan
Key features include dynamic Fibonacci level drawing based on current price ranges, real tick volume data (not simulated), and a clean, non-repainting interface. Users can customize swing detection sensitivity, toggle volume delta display, and enable or disable projection lines with selectable Fibonacci extension levels.
This indicator serves as the analytical foundation for the Fib Volume Delta Bot, an automated trading solution that applies the same logic for trade execution and risk management. It is intended as a decision-support tool to identify retracement zones, confirm entries with volume delta, and project realistic targets, suitable for manual or semi-automated trading workflows.