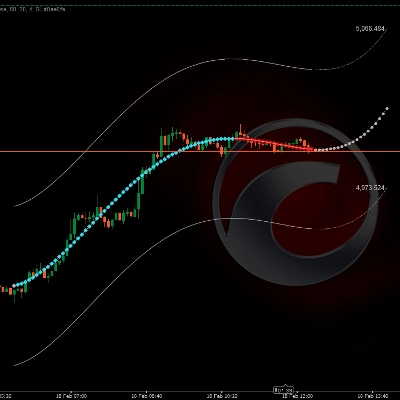
📊 Kanał Projekcji Cen Wielomianowych
https://chartshots.spotware.com/c/699603101593d
🔎 CO TO ROBI?
https://chartshots.spotware.com/c/69960348da652
Dopasowuje krzywą matematyczną do ostatnich N zamknięć cen i przedłuża ją w przyszłość jako projekcję. Wokół tej krzywej rysuje górny i dolny kanał, którego szerokość automatycznie dostosowuje się do ostatniej zmienności rynku.
⚙️ JAK DZIAŁA LOGIKA?
- Pobiera ostatnie N świec (Lookback Bars) i oblicza krzywą wielomianową najlepiej dopasowaną do tych cen metodą najmniejszych kwadratów.
- Przedłuża krzywą do przodu (Forecast Bars) jako matematyczną projekcję obecnego trendu.
- Buduje kanał przesuwając krzywą w górę i w dół, wykorzystując maksymalny zakres świecy z analizowanego okresu × 2.
https://chartshots.spotware.com/c/6996039a07e3a
🛠️ KLUCZOWE PARAMETRY
Parametr
Domyślnie
Cel
Lookback Bars
80
Ile historycznych świec jest analizowanych
Forecast Bars
20
Ile świec jest prognozowanych do przodu
Rząd wielomianu
4
Elastyczność krzywej (wyższa = więcej zakrzywień)
Dane wejściowe
Zamknięcie
Cena bazowa do obliczeń
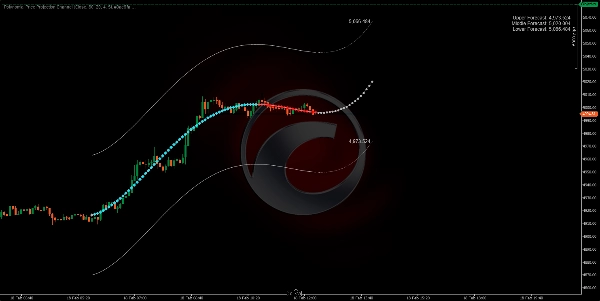
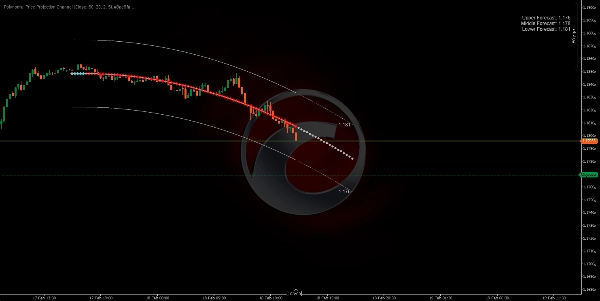
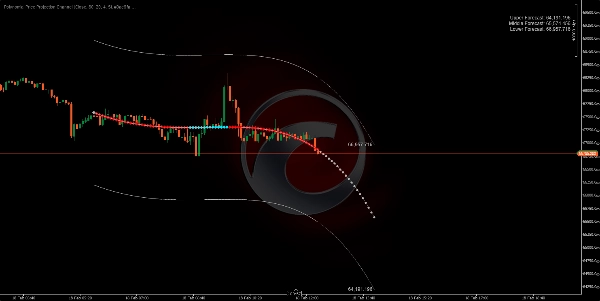
🎯 JAK GO UŻYWAĆ?
🟢 Potencjalny zakup → Cena dotyka dolnego pasa, a projekcja wskazuje w górę.
🔴 Potencjalna sprzedaż → Cena dotyka górnego pasa, a projekcja wskazuje w dół.
⚠️ Zawsze potwierdzaj innymi czynnikami przed dokonaniem transakcji. Ten wskaźnik to matematyczna ekstrapolacja, a nie gwarantowana prognoza.
5 | 0 % | |
4 | 100 % | |
3 | 0 % | |
2 | 0 % | |
1 | 0 % |


