설명
시장 구조 엑스레이
시간 프레임 전환 없이 전체 시장 구조 보기
대부분의 트레이더가 전략이 틀려서 지는 것이 아닙니다.
불완전한 정보로 거래하기 때문에 지는 것입니다.
상위 시간 프레임의 편향을 확인하고 진입을 위해 하위 시간 프레임으로 전환하지만, 맥락을 잃습니다.
캔들이 형성되는 것을 보지만, 그 안에서 무슨 일이 일어나는지는 보지 못합니다.
깨끗해 보이는 거래에 진입하지만 완전히 보지 못한 구조에 의해 무효화됩니다.
당신이 틀린 것이 아닙니다. 단지 전체 그림을 보지 못하고 있을 뿐입니다.
이 도구가 하는 일
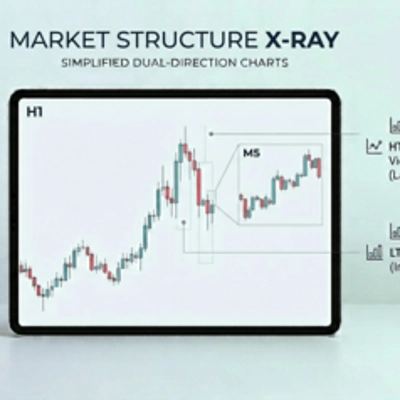
시장 구조 엑스레이는 단일 차트 내에서 진정한 다중 시간 프레임 가시성을 제공합니다.
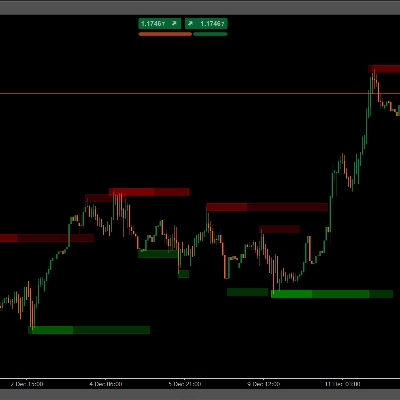
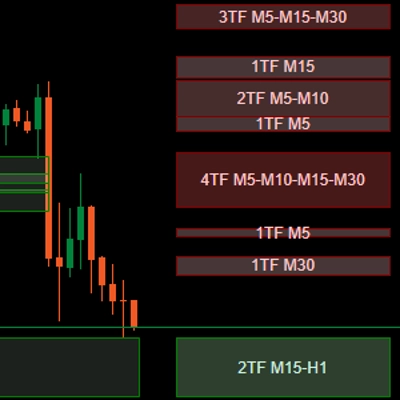
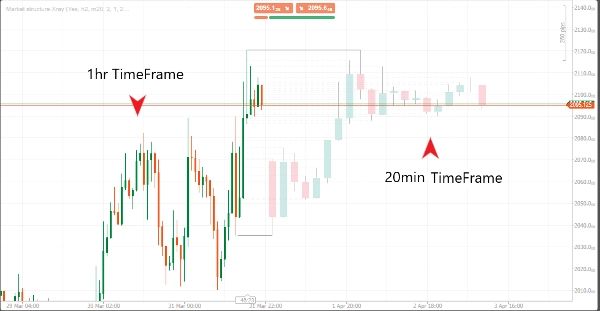
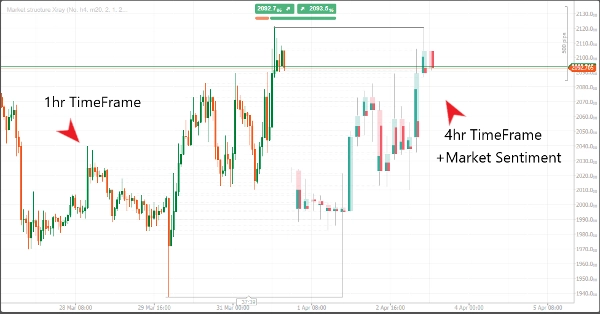
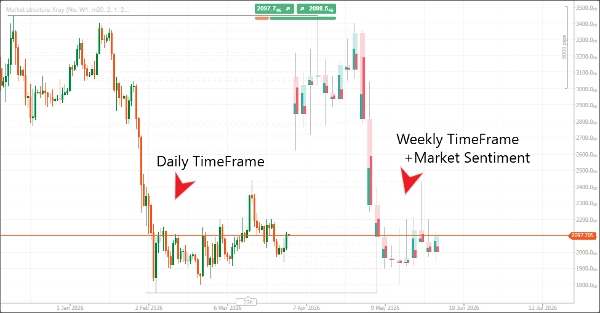
- 상위 시간 프레임 캔들을 현재 차트에 투영
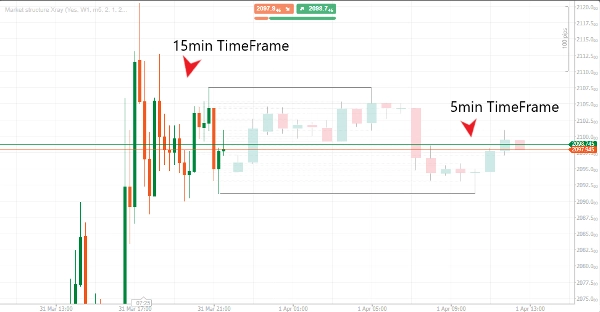
- 하위 시간 프레임 활동을 상위 시간 프레임 구조로 압축
- 각 캔들 내부의 강세 및 약세 심리 공개
전환 없음. 추측 없음. 맹목적 실행 없음.
이것이 바뀌는 점
- 상위 시간 프레임 확인과 함께 하위 시간 프레임에서 실행
- 실패하기 전에 약한 움직임 식별
- 각 캔들이 내부적으로 어떻게 형성되는지 이해
- 더 빠르고 자신감 있는 거래 결정
핵심 기능
상위 시간 프레임 투영
현재 차트에서 직접 형성되는 상위 시간 프레임 캔들 보기.
실행 시간 프레임을 벗어나지 않고 구조와 일치 유지.
하위 시간 프레임 압축
하위 시간 프레임 가격 움직임이 각 상위 시간 프레임 캔들을 어떻게 만드는지 보기.
모든 움직임 뒤에 숨겨진 진짜 이야기를 이해.
내부 심리 시각화
각 캔들은 강세와 약세 압력 간의 균형을 보여줍니다.
단순한 시가와 종가가 아니라 내부에서 무슨 일이 일어났는지.
미래 투영 표시
투영된 캔들은 현재 가격 앞에 표시되어 구조를 계획하고 예상할 수 있게 합니다.
깔끔한 시각 디자인
차트를 복잡하게 하지 않고 명확성을 높이도록 설계된 최소한의 오버레이.
대상 사용자
- ICT 또는 SMC 개념을 사용하는 트레이더
- 상위 시간 프레임 편향이 필요한 스캘퍼
- 차트 간 전환에 지친 일중 거래자
- 신호가 아닌 구조에 집중하는 트레이더
비대상 사용자
- 자동 매수/매도 신호를 찾는 초보자
- 시장 구조를 이해하지 못하는 트레이더
- 완전 자동화 시스템을 기대하는 사람
제공 내용
- 시장 구조 엑스레이 인디케이터
- 거래 명확성 플레이북
- 차트 설정 템플릿
- 실행 모델 가이드
- 평생 업데이트
최종 관점
더 많은 인디케이터가 필요하지 않습니다.
가격에 대한 더 나은 가시성이 필요합니다.
이 도구는 대부분의 트레이더가 볼 수 없는 방식으로 시간 프레임 전반의 구조를 볼 수 있는 능력을 제공합니다.
그 차이가 무작위 실행과 통제된 의사결정을 구분합니다.
요약
Key features include higher timeframe projection, lower timeframe compression, internal sentiment visualization, and forward projection display, which shows projected candles ahead of the current price to aid in planning and anticipation. The indicator uses minimal overlays to maintain chart clarity.
This tool supports trading across various markets including Forex, indices, commodities, cryptocurrencies, and stocks. It is intended for traders familiar with market structure concepts such as ICT or SMC, scalpers needing higher timeframe bias, and intraday traders who prefer to avoid switching between multiple charts. The package includes the Market Structure X-Ray indicator, a trade clarity playbook, chart setup templates, and an execution model guide, with lifetime updates provided.
Market Structure X-Ray aims to enhance trading decisions by delivering a clearer, more complete view of price action across timeframes, facilitating faster and more confident execution based on structural context rather than isolated signals.
상담
고객 리뷰
5 | 0 % | |
4 | 100 % | |
3 | 0 % | |
2 | 0 % | |
1 | 0 % |