Penerangan
━━━━━━━━━━━━━━━━━━━━━━━━━━━━━━━━━━━━━━━━
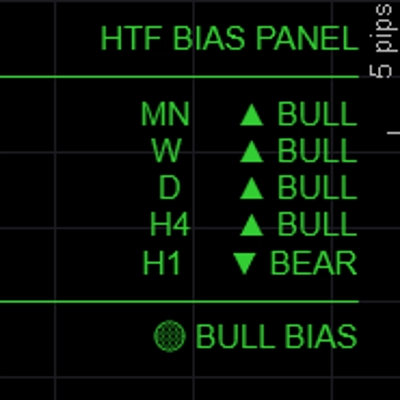
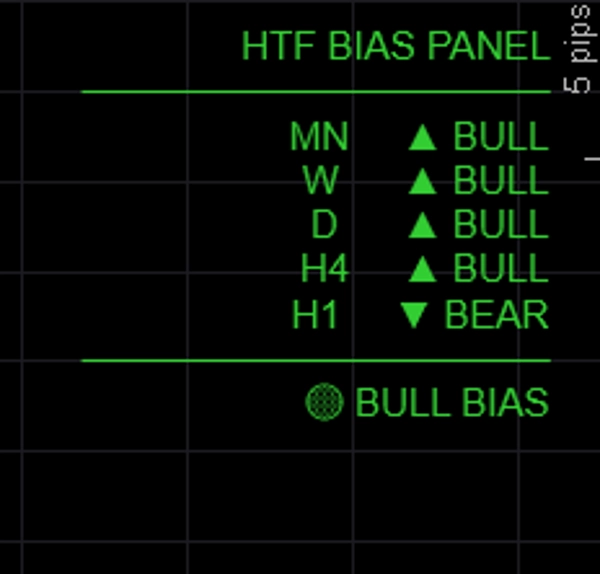
Panel Bias HTF — Bias
━━━━━━━━━━━━━━━━━━━━━━━━━━━━━━━━━━━━━━━━
Menunjukkan bias arah untuk sehingga lima jangka masa serentak dalam panel bersih di carta — jadi anda sentiasa tahu sama ada jangka masa yang lebih tinggi adalah bullish, bearish, atau campuran sebelum memasuki perdagangan.
─────────────────────────────
CIRI UTAMA
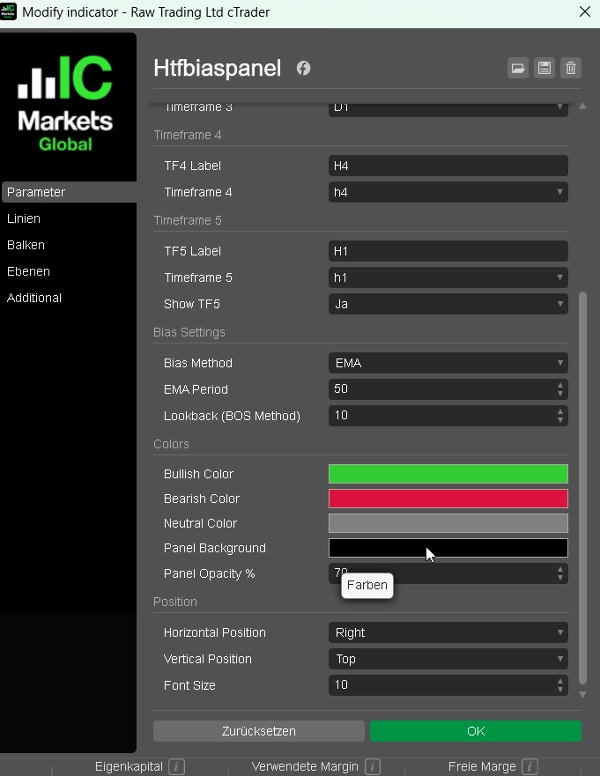
► 5 jangka masa yang boleh dikonfigurasikan sepenuhnya — lalai MN / W / D / H4 / H1, semua label dan TF boleh disesuaikan
► Tiga kaedah bias — pilih bagaimana bias ditentukan setiap sesi:
• EMA: tutup di atas/bawah EMA(50) → paling boleh dipercayai untuk mengikuti trend
• Harga vs Tutup Terakhir: tutup semasa vs tutup sebelumnya → reaktif, berasaskan momentum
• BOS: julat terkini vs julat sebelumnya → bias berasaskan struktur
► Ringkasan penjajaran — BULL PENUH / BEAR PENUH / BIAS BULL / BIAS BEAR / NEUTRAL dipaparkan di bahagian bawah panel
► Output berwarna — hijau untuk bullish, merah untuk bearish, kelabu untuk neutral
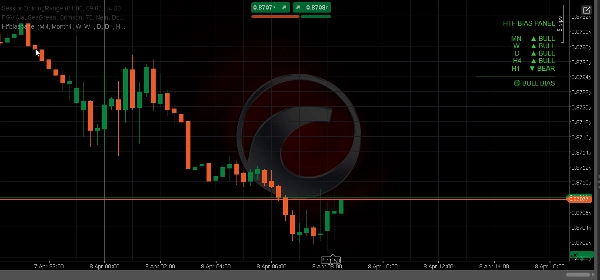
► Kedudukan panel — letakkan kiri atas, kanan atas, tengah atas, kiri bawah, atau kanan bawah
► Warna boleh disesuaikan sepenuhnya untuk keadaan bullish, bearish, dan neutral
► Ringan — tiada lukisan carta, tiada segi empat tepat, tiada beban tambahan
─────────────────────────────
KAEDAH BIAS DIJELASKAN
→ EMA (lalai): Bullish jika tutup > EMA(tempoh). Paling stabil, mengabaikan bunyi jangka pendek.
→ Harga vs Tutup Terakhir: Bullish jika tutup bar semasa > tutup bar sebelumnya. Pantas dan reaktif.
→ BOS: Membandingkan julat N-bar terkini dengan julat N-bar sebelumnya. Bullish jika tinggi lebih tinggi dan rendah lebih tinggi.
─────────────────────────────
TETAPAN LALAI
→ TF1 Bulanan (MN)
→ TF2 Mingguan (W)
→ TF3 Harian (D)
→ TF4 H4
→ TF5 H1 (boleh ditogol)
→ Kaedah Bias EMA
→ Tempoh EMA 50
→ Warna Bull LimeGreen
→ Warna Bear Crimson
→ Kedudukan Kiri Atas
─────────────────────────────
CARA MENGGUNAKAN
1. Tambah panel ke mana-mana carta
2. Pilih kaedah bias pilihan anda (EMA disyorkan untuk pemula)
3. Semak ringkasan penjajaran sebelum memasuki perdagangan — hanya ambil posisi panjang apabila BIAS BULL atau BULL PENUH
4. Gunakan bias HTF untuk menapis isyarat dari penunjuk BOS/CHoCH atau FVG anda — hanya berdagang dalam arah yang disahkan oleh panel
5. Laraskan jangka masa untuk padan dengan gaya perdagangan anda (contoh D / H4 / H1 / M15 / M5 untuk scalper)
─────────────────────────────
SESUAI UNTUK
✔ Pedagang ICT dan Konsep Wang Pintar yang memerlukan analisis cepat dari atas ke bawah
✔ Pedagang pelbagai jangka masa yang mahukan pemeriksaan bias visual yang pantas
✔ Pedagang FTMO dan firma prop yang perlu berdagang dengan konfluens
✔ Mana-mana pedagang yang ingin mengelakkan perdagangan bertentangan dengan trend jangka masa lebih tinggi
✔ Pedagang Forex, Emas, Indeks, dan CFD Kripto
─────────────────────────────
KESERASIAN
→ Platform cTrader (Desktop & Web)
→ Kelas aset Forex, Indeks, Komoditi, CFD Kripto
→ Jangka masa Semua (M1 hingga MN)
→ Hak akses Tiada diperlukan
→ Jenis akaun Langsung & Demo
━━━━━━━━━━━━━━━━━━━━━━━━━━━━━━━━━━━━━━━━
Ringkasan
Ulasan pelanggan
5 | 75 % | |
4 | 25 % | |
3 | 0 % | |
2 | 0 % | |
1 | 0 % |


![Logo "[Stellar Strategies] MARSI Signal Plotter"](https://cdn.ctrader.com/image/webp/7b2b8da6-8f8e-4646-8d4a-4710c516c01e_25567)


