Penerangan
The Trendlines Oscillator membantu pedagang mengenal pasti tren dan momentum berdasarkan jarak dinormalisasi antara harga semasa dan garis tren bullish dan bearish yang dikesan baru-baru ini.
Penunjuk ini menampilkan momentum bullish dan bearish, garis isyarat dengan persilangan, dan pelbagai pilihan pelicinan.
PENGGUNAAN
The Trendlines Oscillator berfungsi dengan secara sistematik:
- Mengenal pasti puncak dan lembah pivot.
- Menyambungkan pivot untuk membentuk garis tren bullish (sokongan) dan bearish (rintangan).
- Mengukur jarak (delta) antara harga semasa dan garis tren tersebut.
- Menormalkan jarak ini antara 0 dan 100 untuk menghasilkan nilai momentum.
- Melicinkan nilai untuk isyarat yang lebih bersih.
- Menjana isyarat bullish dan bearish apabila momentum melintasi garis isyarat.
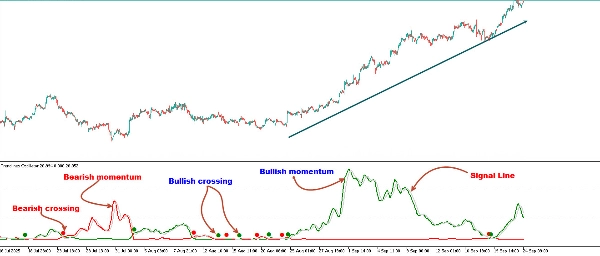
Osilator memaparkan tiga garis utama:
Garis Momentum Bullish (Hijau): Mengukur kekuatan pembeli dengan mengira sejauh mana harga dari garis tren sokongan bullish terkini.
Garis Momentum Bearish (Merah): Mengukur kekuatan penjual dengan mengira sejauh mana harga dari garis tren rintangan bearish terkini.
Garis Isyarat (Kelabu): Menyediakan persilangan dengan garis momentum untuk menonjolkan peluang perdagangan yang berpotensi.
Sebagai peraturan umum, apabila garis momentum bullish berada di atas garis momentum bearish, ia menunjukkan kekuatan pembeli. Ini bermakna harga sebenar lebih jauh dari garis tren sokongan berbanding garis tren rintangan. Sebaliknya benar untuk kekuatan penjual.
Untuk mengira momentum bullish, alat ini pertama mengenal pasti garis tren bullish yang bertindak sebagai sokongan di bawah harga. Kemudian, ia mengukur delta antara harga dan garis tren tersebut dan menormalkan bacaan ke dalam nilai momentum yang dipaparkan.
Proses yang sama digunakan untuk momentum bearish, tetapi dengan garis tren bearish yang bertindak sebagai rintangan di atas harga.
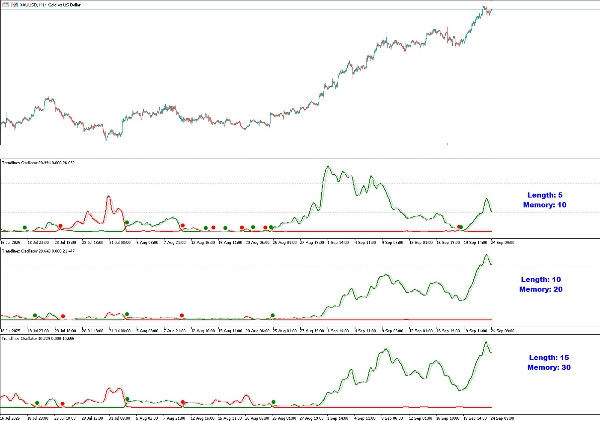
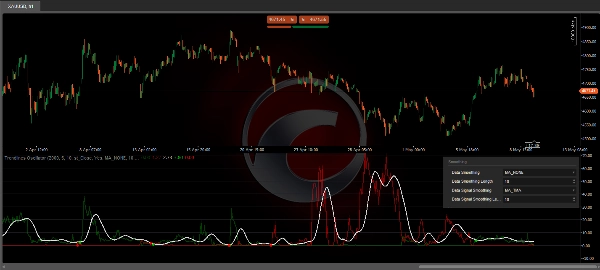
Panjang & Memori
- Panjang: Menentukan saiz struktur pasaran yang digunakan untuk mengesan garis tren. Nilai yang lebih besar menangkap tren yang lebih luas, manakala nilai yang lebih kecil menjadikan alat lebih sensitif terhadap pergerakan jangka pendek.
- Memori: Mengawal berapa banyak garis tren yang dipertimbangkan dalam pengiraan. Nilai memori yang lebih tinggi melicinkan isyarat untuk analisis jangka panjang, manakala nilai memori yang lebih kecil menawarkan reaksi yang lebih cepat.
Mengubah nilai Panjang dan Memori akan menyebabkan alat memaparkan nilai momentum yang berbeza.
Pedagang boleh melaraskan panjang untuk mengesan garis tren yang lebih besar dan melaraskan memori untuk menunjukkan berapa banyak garis tren yang harus dipertimbangkan oleh alat.
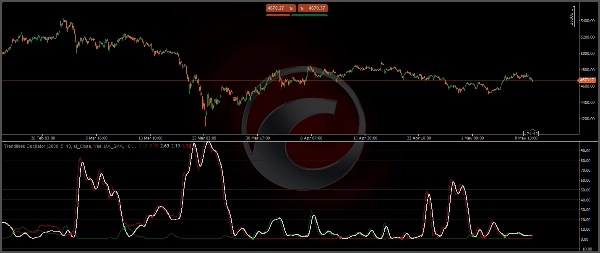
Seperti yang ditunjukkan dalam carta di atas, nilai yang lebih kecil menjadikan alat lebih responsif, manakala nilai yang lebih besar berguna untuk mengesan tren yang lebih besar.
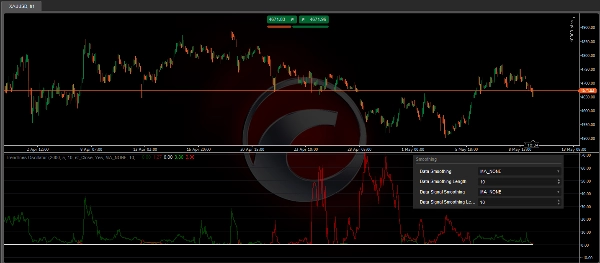
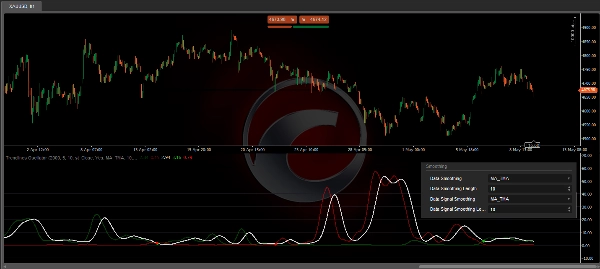
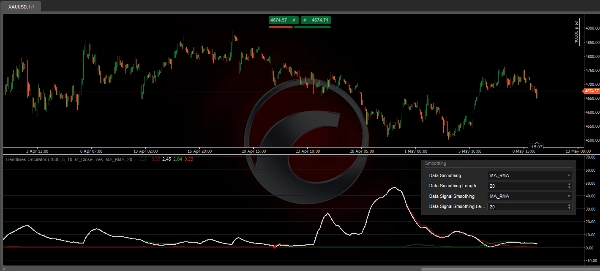
Pelicinan
- Pelicinan Data: Menerapkan pelicinan pada nilai momentum mentah.
- Pelicinan Isyarat: Melicinkan garis isyarat itu sendiri untuk titik persilangan yang lebih jelas.
Secara lalai, data dilicinkan oleh SMA, dan isyarat menggunakan purata bergerak segitiga dengan panjang 10. Pedagang boleh melicinkan kedua-dua data dan garis isyarat.
Pedagang boleh memilih kaedah yang berbeza, atau tiada. Beberapa contoh ditunjukkan pada imej yang dilampirkan.
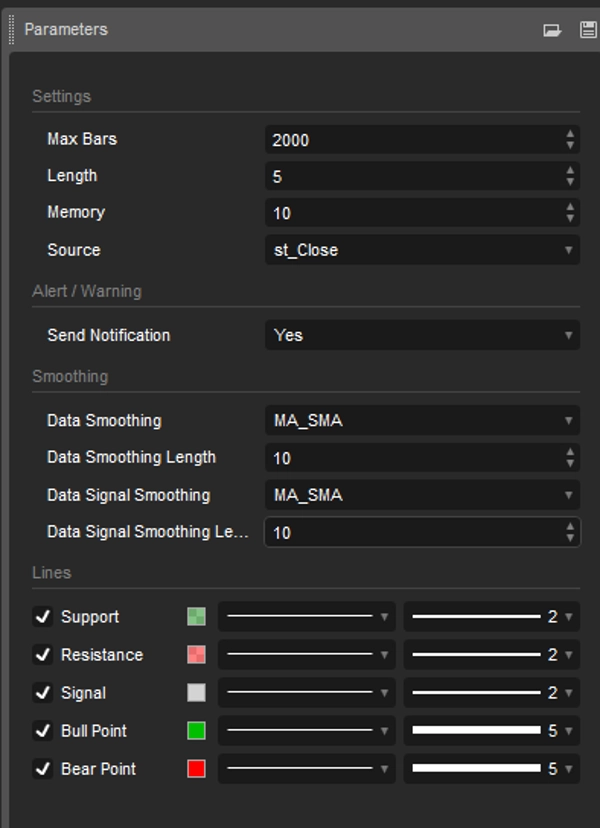
TETAPAN
- Panjang: Saiz struktur pasaran yang digunakan untuk pengesanan garis tren.
- Memori: Bilangan garis tren yang digunakan dalam pengiraan.
- Sumber: Sumber untuk pengiraan adalah harga penutupan secara lalai.
- Pelicinan Data: Pilih kaedah dan panjang pelicinan
- Pelicinan Isyarat: Pilih kaedah dan panjang pelicinan
- Amaran: Amaran/Pemberitahuan apabila Persilangan Bullish/Bearish
- Gaya: Laraskan warna, gaya, lebar garis Sokongan/Rintangan/Isyarat
Penunjuk perdagangan Trendlines Oscillator adalah ideal untuk pedagang yang mahukan:
- Pandangan momentum berasaskan garis tren daripada hanya bergantung pada purata bergerak atau RSI.
- Persilangan visual yang jelas untuk menandakan kemasukan dan keluar yang berpotensi.
- Pelicinan yang boleh disesuaikan untuk menyesuaikan dengan gaya perdagangan yang berbeza.
- Alat yang menonjolkan dominasi pembeli vs penjual secara masa nyata.
- Dengan menggabungkan analisis struktur pasaran dengan pengiraan momentum, alat ini memberikan kelebihan unik dalam mengenal pasti peluang kesinambungan dan pembalikan tren.
Ringkasan
Users can customize the indicator’s sensitivity and responsiveness by adjusting the Length (market structure size for trendline detection) and Memory (number of trendlines considered). The tool also offers data and signal smoothing options using various methods, including SMA and triangular moving averages, to provide clearer signals. The Trendlines Oscillator supports alerts for bullish and bearish crossovers and allows customization of line styles and colors. It provides a structural market analysis combined with momentum calculations to help traders assess buyer versus seller dominance and identify trend continuation or reversal opportunities.


