
คำอธิบาย
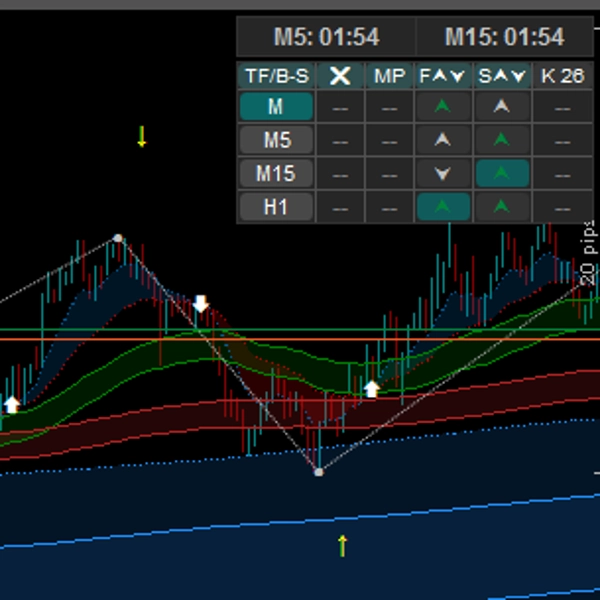
Ultimate MTF Trend & Momentum Dashboard เป็นชุดวิเคราะห์ขั้นสูงที่ออกแบบมาเพื่อแก้ไข "ความยุ่งเหยิงของชาร์ต" พร้อมให้บริบทตลาดระดับสถาบันแก่คุณ โดยการรวบรวมข้อมูลสำคัญจากหลายกรอบเวลาเข้าสู่แผงควบคุมแบบอินเทอร์แอคทีฟบนชาร์ตที่ดูเรียบง่าย ช่วยให้คุณตัดสินใจซื้อขายได้เร็วขึ้นและมั่นใจมากขึ้น ไม่ว่าคุณจะเป็นนักเก็งกำไรในกรอบเวลาต่ำหรือเทรดเดอร์สวิงรายวัน เครื่องมือนี้ให้ข้อมูลเชิงลึกที่แม่นยำเกี่ยวกับความแข็งแกร่งของแนวโน้ม การดึงกลับที่เป็นไปได้ และระดับโครงสร้างสำคัญ ตัวบ่งชี้ที่ออกแบบมาเพื่อเข้าสู่การเล่นกึ่งอัตโนมัติด้วยตนเองหรือกับบอท https://ctrader.com/products/3618
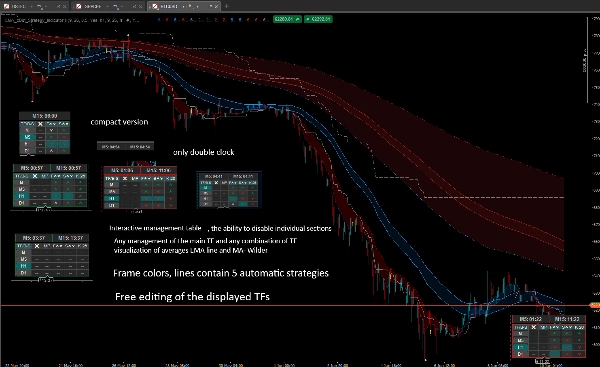
มีความเป็นไปได้ที่จะแสดง TF และการรวมกันของ TF ใด ๆ ของค่าเฉลี่ยที่แสดง - แตกต่างจาก TF ปัจจุบันบน cTrader
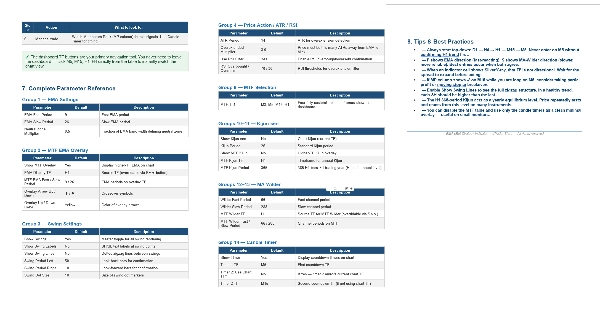
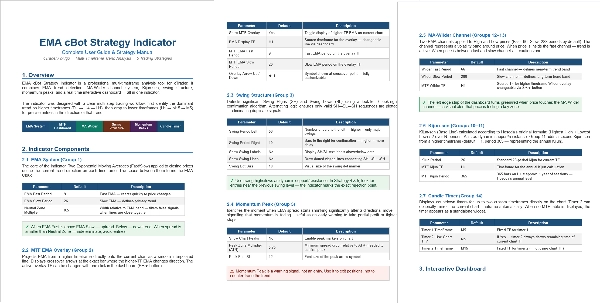
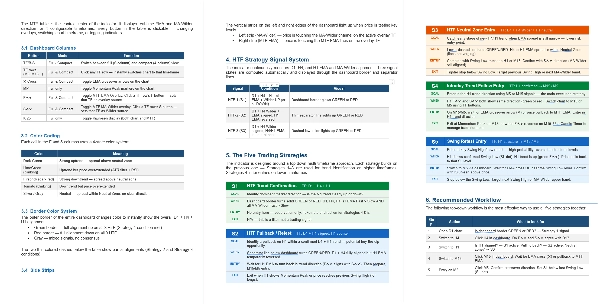
คู่มือ - https://clogic-algo.github.io/EMA_cBot_Strategy_Guide/EMA_Strategy_Guide.html
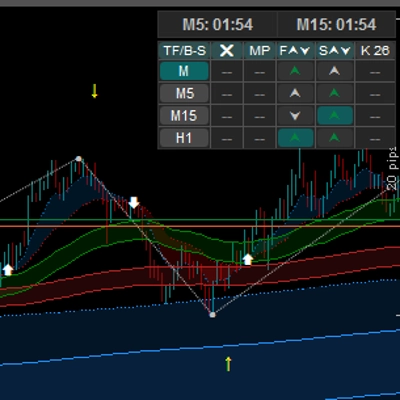
1. แดชบอร์ดมัลติไทม์เฟรม (MTF) แบบอินเทอร์แอคทีฟ
- ตรวจสอบได้สูงสุด 4 กรอบเวลา (เช่น M1, M5, H1, D1) พร้อมกันภายในแผง UI ที่สะอาดตา
- UI ที่คลิกได้: เปลี่ยนกรอบเวลาชาร์ตของคุณทันทีเพียงคลิกปุ่มบนแดชบอร์ด!
- โหมดกะทัดรัด / เต็มรูปแบบ: สลับขนาดของแดชบอร์ดเพื่อแสดงหรือซ่อนเมตริกขั้นสูง (สัญญาณ EMA, Wilder, Kijun และ Momentum) เพื่อประหยัดพื้นที่หน้าจอ
- ขอบการจัดแนว HTF: ขอบแดชบอร์ดเปลี่ยนสีแบบไดนามิกเพื่อแจ้งเตือนเมื่อกรอบเวลาที่สูงขึ้น (H1, H4, D1) อยู่ในแนวเดียวกันเต็มที่
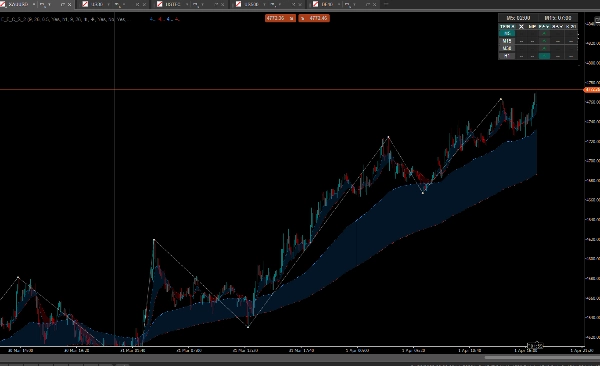
2. โครงสร้างตลาดอัตโนมัติ (Swing High / Swing Low)
- ระบุและทำเครื่องหมายจุดเปลี่ยน (Swing Highs / Lows) โดยอัตโนมัติด้วยจุดและป้ายข้อความที่มองเห็นได้
- เลือกวาดเส้น Swing (สไตล์ Zig-Zag) เพื่อดูคลื่นตลาดและการแตกหักของโครงสร้างตลาดได้ง่ายขึ้น
- ควบคุมความไวของ swing ได้เต็มที่ (ปรับช่วงเวลามองย้อนหลังของแท่งซ้าย/ขวาได้)
3. ค่าเฉลี่ยเคลื่อนที่ขั้นสูง & เมฆแนวโน้ม
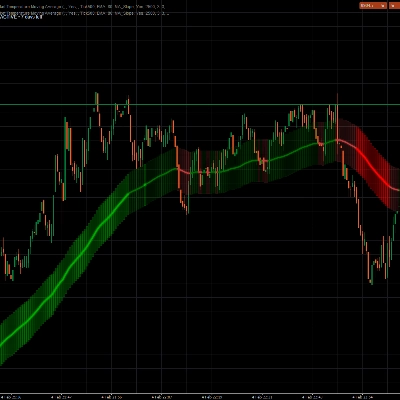
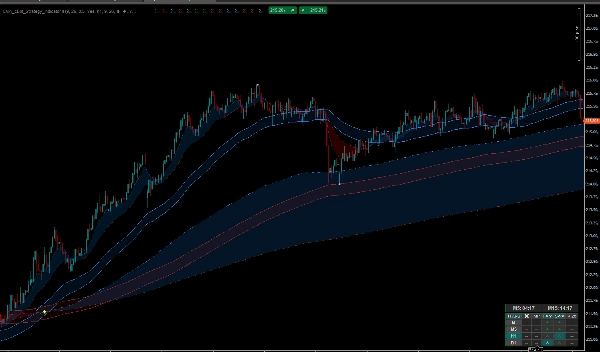
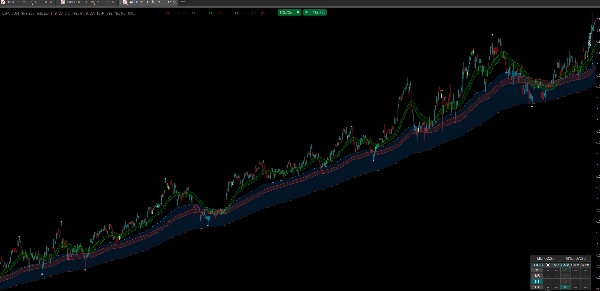
- แสดงทิศทางแนวโน้มโดยใช้ "เมฆ" โปร่งใสที่วางระหว่างค่าเฉลี่ยเคลื่อนที่เร็วและช้า (EMA & MA-Wilder)
- การซ้อนทับ MTF ที่แท้จริง: วาง EMA ของกรอบเวลาที่สูงกว่า (เช่น EMA 1 ชั่วโมง) ลงบนชาร์ตกรอบเวลาต่ำปัจจุบันของคุณ (เช่น 5 นาที) อย่างราบรื่นและไม่บิดเบือน
- ลูกศรและการแจ้งเตือนในตัวสำหรับการตัดกันของ EMA
4. การหมดแรงของแนวโน้ม & จุดสูงสุดของโมเมนตัม
- ใช้สมการอัจฉริยะร่วมกับตัวกรอง ATR และ RSI เพื่อตรวจจับเมื่อราคาขยายตัวมากเกินไป
- จุดสูงสุดของโมเมนตัม: ตัวบ่งชี้วิเคราะห์ "การกระจาย" ระหว่างค่าเฉลี่ยเร็วและช้า เมื่อแรงโมเมนตัมแรงจบลงและค่าเฉลี่ยเริ่มหดตัว มันจะแสดงลูกศรเตือน "จุดสูงสุด" เฉพาะ ซึ่งเป็นเครื่องมือที่ยอดเยี่ยมสำหรับการสังเกตการดึงกลับและโซนทำกำไร
5. การสนับสนุน Ichimoku (Kijun-sen)
- สลับเส้น Kijun-sen คลาสสิกเพื่อทำหน้าที่เป็นแนวรับ/แนวต้านแบบไดนามิก
- รวมตัวเลือก MTF Kijun เพื่อแสดงเส้นฐานจากกรอบเวลาที่สูงกว่าบนชาร์ตปัจจุบันของคุณ
6. แถบสถานะ Edge & ตัวจับเวลาคู่ของแท่งเทียน
- "แถบ Edge" ที่มีรหัสสีอย่างละเอียดถี่ถ้วน (ขีด) ข้างแดชบอร์ดให้คุณอ่านแนวโน้มกรอบเวลาที่สูงกว่าได้ทันที เพื่อให้แน่ใจว่าคุณไม่ซื้อขายสวนทางกับแนวโน้มหลัก
- ตัวจับเวลานับถอยหลังคู่ในตัวที่แสดงเวลาที่เหลือสำหรับแท่งเทียนปัจจุบันและแท่งเทียนกรอบเวลาที่สูงกว่า (เช่น M5 และ H1) พร้อมกัน
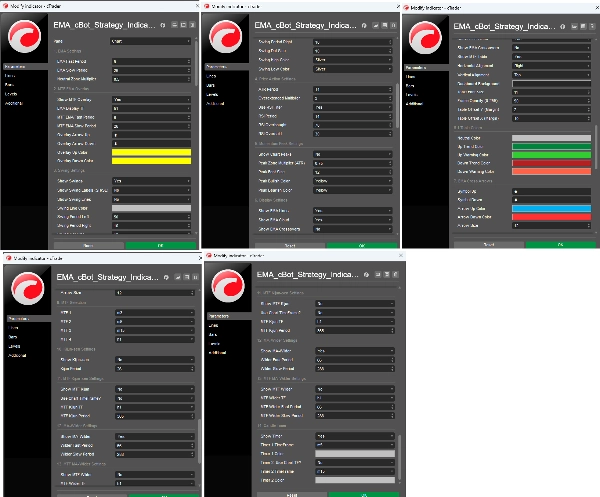
⚙️ การปรับแต่งขั้นสูงสุด:
ตัวบ่งชี้นี้ถูกสร้างขึ้นเพื่อปรับให้เข้ากับกลยุทธ์ของคุณ คุณมีการควบคุมเต็มที่เหนือ:
- ช่วงเวลาและพารามิเตอร์สำหรับค่าเฉลี่ยเคลื่อนที่ทั้งหมด (EMA, Wilder, Kijun)
- การปรับแต่งสี UI อย่างสมบูรณ์ (เมฆ, พื้นหลังแผง, ข้อความ, การเตือนแนวโน้ม)
- ตำแหน่งแดชบอร์ด (ซ้าย/ขวา, บน/ล่าง), ระยะขอบ และความทึบแสง
- เกณฑ์ตัวกรอง ATR และ RSI เพื่อกำจัดสัญญาณเท็จ
ตัวบ่งชี้นี้เหมาะกับใคร?
- ผู้ติดตามแนวโน้ม ที่ต้องการให้การเข้าซื้อของพวกเขาสอดคล้องกับโมเมนตัมกรอบเวลาที่สูงกว่า
- เทรดเดอร์ราคาแอคชัน ที่พึ่งพาโครงสร้างตลาด Swing High/Low ที่แม่นยำ
- นักเทรดรายวัน & สแคลเปอร์ ที่ต้องการอ่านแนวโน้ม H1/H4/D1 อย่างต่อเนื่องโดยไม่ทำให้พื้นที่ทำงานของพวกเขายุ่งเหยิงด้วยหน้าต่างหลายบาน
เพิ่มประสิทธิภาพพื้นที่หน้าจอของคุณและรับข้อได้เปรียบอย่างมากด้วยบริบทมัลติไทม์เฟรมที่แท้จริง ติดตั้งแดชบอร์ดวันนี้และปรับให้เหมาะสมกับสไตล์การเทรดของคุณอย่างสมบูรณ์แบบ!
สรุป
Key features include visualization of trend direction through transparent clouds between fast and slow moving averages (EMA and Wilder MA), true MTF overlays that plot higher timeframe EMAs on lower timeframe charts without distortion, and built-in alerts for EMA crossovers. It incorporates a smart algorithm with ATR and RSI filters to detect trend exhaustion and momentum peaks, signaling potential pullbacks or take-profit zones.
The indicator also supports Ichimoku Kijun-sen lines as dynamic support/resistance, with multi-timeframe options. Additional tools include color-coded edge status strips indicating higher timeframe trend bias and a dual candle countdown timer for current and higher timeframe candles.
Users have full customization over moving average parameters, UI colors, dashboard positioning, and filter thresholds. This tool suits trend followers, price action traders, day traders, and scalpers seeking institutional-grade multi-timeframe market context in a streamlined interface.