Penerangan
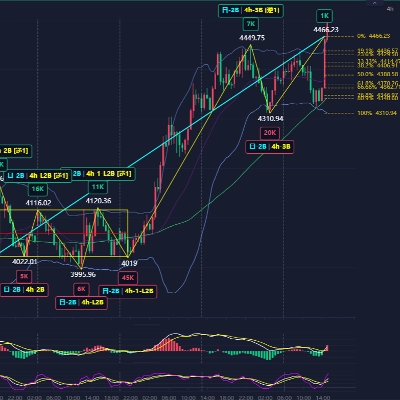
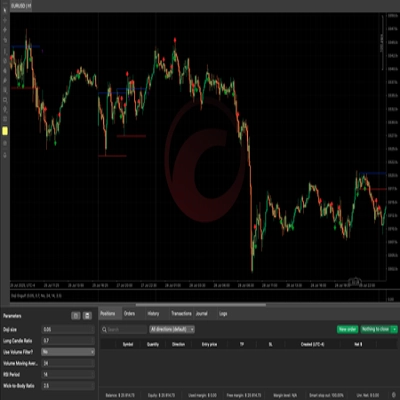
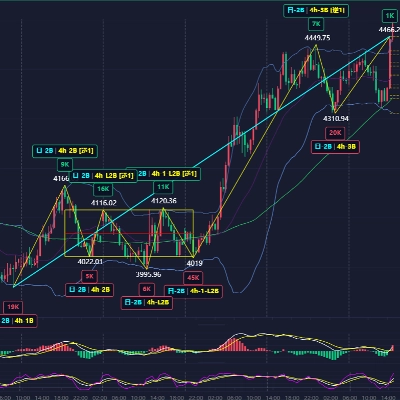
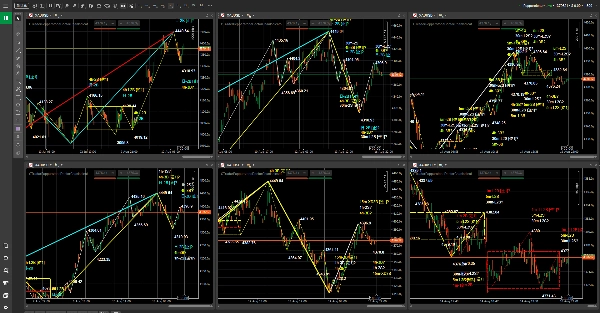
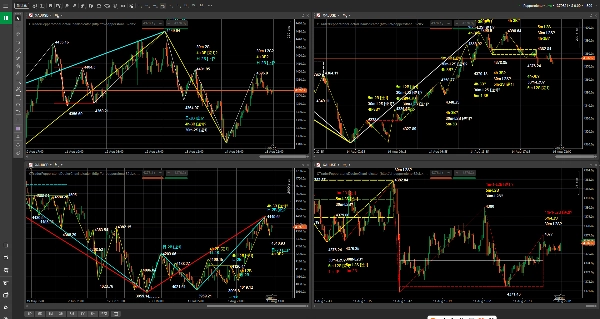
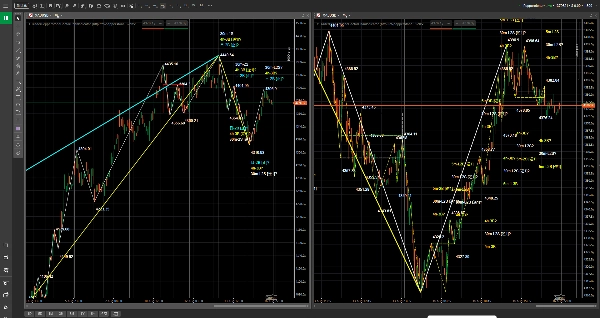
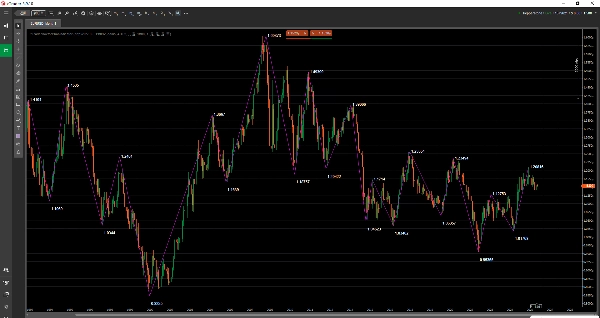
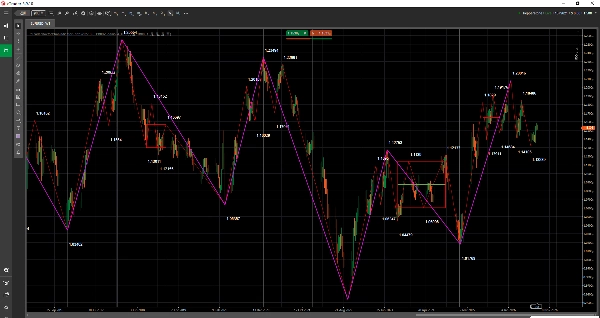
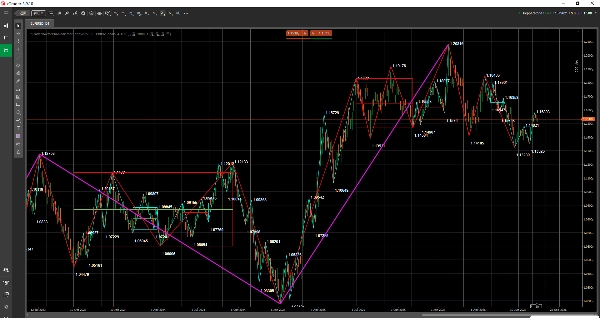
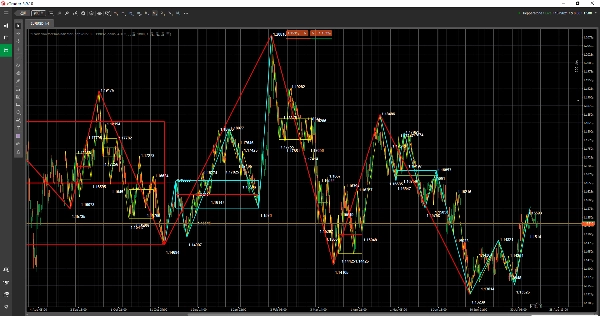
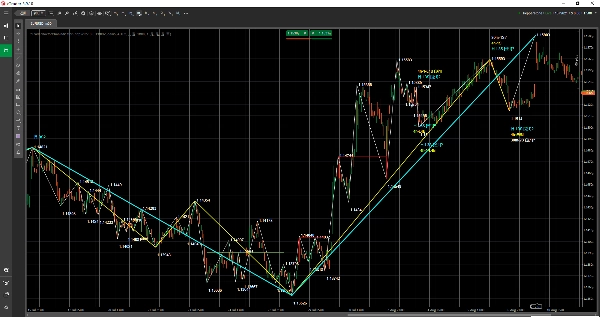
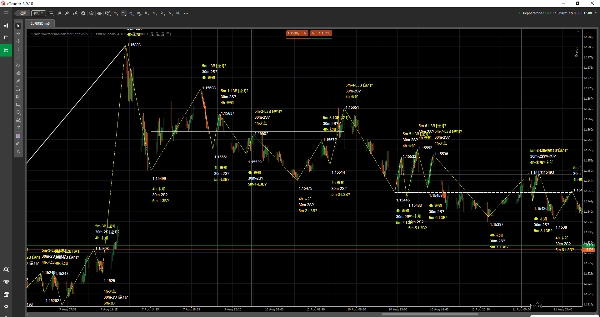
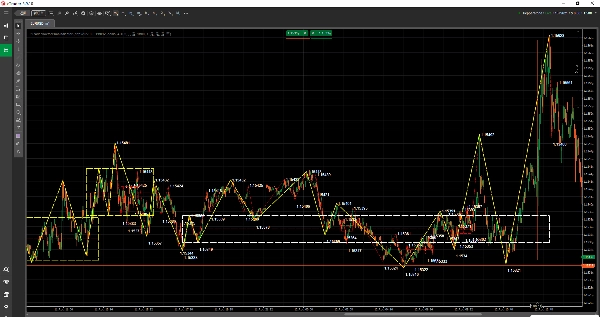
Penunjuk Teori Dr Chan untuk cTrader adalah penunjuk analisis teknikal struktur pasaran / lapisan carta yang digunakan untuk memaparkan struktur Teori Dr Chan pada carta cTrader.
Ia sesuai untuk pedagang yang menumpukan perhatian pada tindakan harga, struktur tren dan analisis pelbagai jangka masa. Penunjuk ini memaparkan struktur utama Teori Dr Chan sebagai objek carta, termasuk struktur Bi, zon Zhongshu, penanda beli/jual dan lain-lain, membantu pengguna memerhati rentak pasaran, perubahan struktur dan hubungan antara jangka masa yang berbeza dengan lebih intuitif.
Penunjuk ini bukan robot dagangan automatik dan bukan perkhidmatan isyarat dagangan. Tujuannya adalah untuk membantu pengguna membaca carta, mengkaji pasaran dan membina pelan dagangan dengan lebih jelas.
Versi semasa serasi dengan simbol dan jangka masa Pepperstone cTrader yang ditentukan. Produk ini adalah penunjuk pihak ketiga bebas dan bukan produk rasmi Pepperstone atau produk rakan kongsi Pepperstone.
Gambaran keseluruhan penunjuk
- Jenis penunjuk: penunjuk struktur pasaran / lapisan carta.
- Instrumen pilihan: Forex, indeks, komoditi, mata wang kripto dan simbol CFD saham yang ditentukan dalam Pepperstone cTrader.
- Jangka masa pilihan: 1 minit, 5 minit, 15 minit, 30 minit, 1 jam, 4 jam, harian, mingguan dan bulanan.
- Kegunaan dagangan: pemerhatian struktur carta, analisis pelbagai jangka masa, penyediaan pelan dagangan dan sokongan semakan.
Apa yang anda boleh lihat pada carta
- Struktur Bi: digunakan untuk memerhati rentak ayunan dan kemajuan struktur.
- Zon Zhongshu: digunakan untuk memerhati kawasan pengukuhan penting, keseimbangan dan pertindihan struktur.
- Penanda beli/jual: digunakan untuk membantu mencari titik rujukan struktur utama.
- Label teks, garis mendatar, garis menegak, kawasan segi empat tepat, garis tren dan objek carta lain.
- Padanan data automatik dengan jangka masa carta semasa disokong secara lalai, memudahkan pemerhatian pelbagai jangka masa.
Siapa penunjuk ini untuk
- Pengguna yang sedang belajar atau menggunakan Teori Dr Chan dan analisis struktur Teori Chan.
- Pengguna yang ingin melihat maklumat struktur secara langsung pada carta cTrader.
- Pengguna yang menggunakan Pepperstone untuk melihat Forex, indeks, komoditi, mata wang kripto atau CFD saham.
- Pedagang yang perlu membandingkan struktur tren merentasi jangka masa yang berbeza.
- Pengguna yang ingin menjadikan aliran kerja membaca carta, perancangan dan semakan lebih jelas.
Akses dan pelesenan
Akses produk dan pelesenan diuruskan melalui proses pembelian, percubaan dan pemasangan di Kedai cTrader. Sila rujuk status pembelian, status percubaan dan maklumat produk yang dipaparkan di halaman produk Kedai cTrader.
Simbol Pepperstone yang disokong sekarang
Forex:
GBPUSD, EURUSD, USDJPY, USDCHF, AUDUSD, USDCAD, GBPJPY
Indeks:
US500, NAS100, GER40, UK100, JPN225, VIX, HSTECH
Komoditi:
XAUUSD, XAGUSD
Mata wang kripto:
BTCUSD, ETHUSD
Saham:
AAPL.US-24, MSFT.US-24, GOOG.US-24, AMZN.US-24, TSLA.US-24, NVDA.US-24, META.US-24, NFLX.US-24, JPM.US-24
Jangka masa yang disokong
1 minit, 5 minit, 15 minit, 30 minit, 1 jam, 4 jam, harian, mingguan dan bulanan.
Aliran kerja yang dicadangkan
1. Buka carta untuk simbol yang disokong dalam persekitaran Pepperstone cTrader.
2. Muatkan Penunjuk Teori Dr Chan ke atas carta.
3. Masa data Penunjuk Teori Dr Chan adalah UTC+0. Apabila memeriksa struktur carta, pastikan menukar zon masa carta cTrader ke zon masa yang sepadan sebelum membandingkan kedudukan.
4. Pastikan jangka masa carta semasa disokong. Penunjuk secara automatik memadankan data dengan jangka masa carta.
5. Hidupkan atau matikan "Show Bi", "Show Zhongshu" dan "Show Buy/Sell" mengikut keperluan.
6. Perhatikan struktur carta bersama pelan dagangan, pengurusan posisi dan kawalan risiko anda sendiri.
Tetapan parameter
Versi semasa hanya mendedahkan 3 parameter yang boleh dilihat berikut dalam panel penunjuk cTrader. Jangka masa data, sufiks simbol broker, cache, segar semula, pemindahan mampat dan tetapan log diuruskan secara dalaman oleh penunjuk dan tidak perlu dikonfigurasikan untuk penggunaan biasa.
Tunjukkan Bi
Nilai lalai: "true"
Sama ada untuk memaparkan struktur Bi.
Tunjukkan Zhongshu
Nilai lalai: "true"
Sama ada untuk memaparkan zon Zhongshu.
Tunjukkan Beli/Jual
Nilai lalai: "true"
Sama ada untuk memaparkan penanda beli/jual.
Nota penting
- Produk ini adalah penunjuk pembantu analisis teknikal, bukan robot dagangan automatik.
- Penunjuk tidak meletakkan pesanan secara automatik.
- Penunjuk tidak merupakan nasihat pelaburan, perkhidmatan isyarat dagangan atau jaminan keuntungan.
- Versi semasa hanya serasi dengan simbol Pepperstone cTrader yang ditentukan dan jangka masa yang ditentukan.
- Masa data Penunjuk Teori Dr Chan adalah UTC+0. Apabila memaparkannya pada carta cTrader, sila tukar ke zon masa carta yang sepadan sebelum memeriksa kedudukan struktur.
- Pengguna harus menggunakannya bersama pelan dagangan, pengurusan posisi, kawalan risiko dan penilaian bebas mereka sendiri.
Arah kemas kini masa depan
Versi keluaran semasa mengutamakan simbol dan jangka masa Pepperstone cTrader yang ditentukan. Kemas kini masa depan mungkin akan terus memperluaskan lebih banyak broker, lebih banyak pemetaan simbol dan skop perkhidmatan data yang lebih lengkap mengikut pelan produk.
Amaran risiko
Perdagangan pasaran kewangan melibatkan risiko. Prestasi lalu tidak menjamin hasil masa depan. Penunjuk ini hanyalah alat pembantu analisis teknikal dan pembelajaran. Ia tidak merupakan nasihat pelaburan, perkhidmatan isyarat dagangan atau jaminan keuntungan. Struktur sejarah tidak mewakili hasil masa depan. Pengguna harus mengujinya sepenuhnya dalam persekitaran dagangan mereka sendiri dan menggunakannya dengan berhati-hati bersama peraturan pengurusan risiko.