
Divergence Indicators for cTrader
Compare divergence indicators for cTrader that highlight potential mismatches between price and momentum. These forex analysis tools help traders spot possible reversals, weakening trends and confirmation signals across oscillators and price action.
Narzędzia
Porównanie narzędzi
Częste pytania


Porównanie narzędzi
Produkt | Opinie | Pobrania | Sprzedaż | Cena | Zgodne platformy |
|---|---|---|---|---|---|
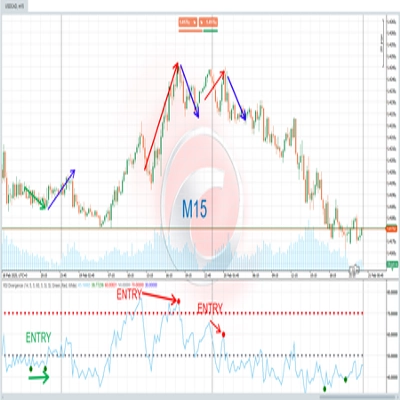
RSI Divergence | 4.0 (1) | 1.74K | — | Za darmo | Windows, Mac |
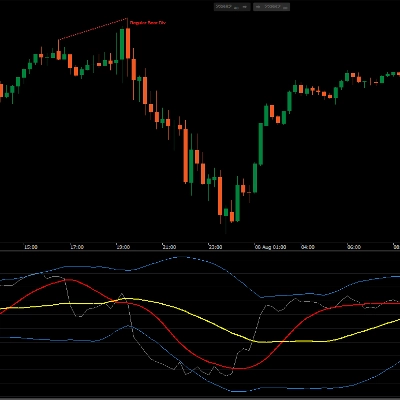
TDI_Pro | 4.3 (3) | — | 5 | $39 | Windows, Mac |
Advanced RSI Indicator | 5.0 (1) | 570 | — | Za darmo | Windows, Mac |
Smart Volume Delta | 3.5 (4) | — | 5 | $19 | Windows, Mac |
Balance of Power | — | 169 | — | Za darmo | Windows, Mac |
[Stellar Strategies] Smart ADX | 4.5 (2) | — | 3 | $39 | Windows, Mac |
Stochastic confluence | 4.0 (1) | 127 | — | Za darmo | Windows, Mac |
Divergence Suite VPro | 4.5 (4) | — | 3 | $25 | Windows, Mac |
High-Low Divergence [Iridio Capital] | 4.8 (4) | — | 2 | od $9 | Windows, Mac |
HTF candles with Timeframe Alignment | 4.5 (2) | — | 2 | $45 | Windows, Mac |
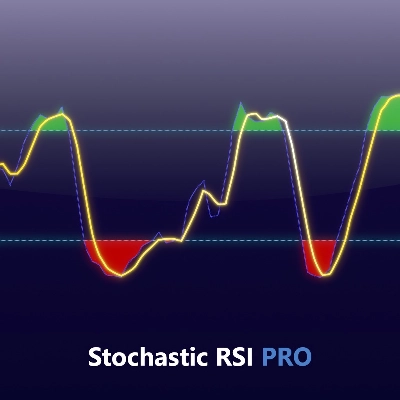
Stochastic RSI PRO | 4.7 (6) | — | 1 | $28 | Windows, Mac |
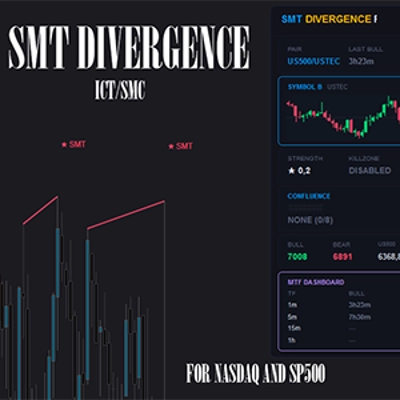
SMT Divergence Pro | 5.0 (2) | — | — | od $19 | Windows, Mac |
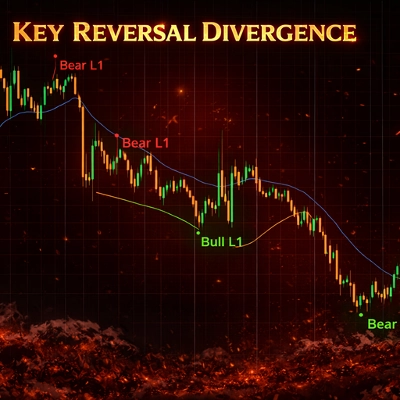
Key Reversal Divergence | 5.0 (4) | — | — | $20 | Windows, Mac |
SMT Divergence | — | — | — | $50 | Windows, Mac |
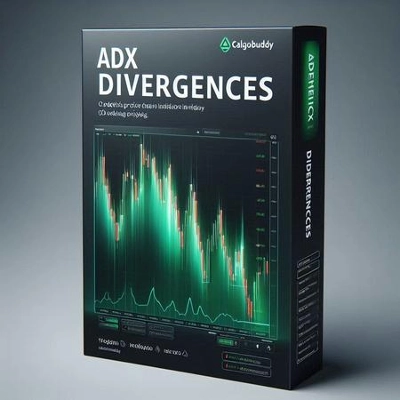
cAlgoBuddy - ADX Divergences | 4.8 (5) | — | — | $20 | Windows, Mac |
Precision Swing Points | 5.0 (3) | — | — | $22 | Windows, Mac |
Częste pytania
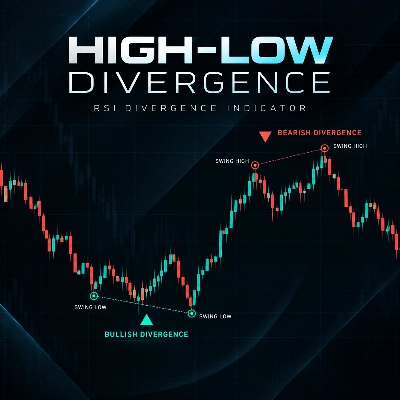
Divergence is a mismatch between price and a momentum oscillator, such as price making a higher high while the oscillator makes a lower high. That bearish case, or its bullish mirror of a lower price low against a higher oscillator low, suggests fading momentum rather than a confirmed reversal.
Common choices are RSI, MACD or its histogram, the stochastic and the momentum oscillator, and some tools let you switch between them. Regular divergence is read as a possible reversal warning, while hidden divergence, such as a higher price low with a lower oscillator low, is read as possible trend continuation.
The pivot lookback matters: a swing high counts only after a set number of lower bars form to its right, so larger values confirm later but more firmly. Tools that draw before that confirmation can remove lines afterwards, so check whether signals stay fixed once shown, and tune the oscillator period separately.
No trades come from it: the tool draws lines between swings, labels the divergence and may alert you, while orders come only from you or a cBot. Divergence can persist through several swings while a trend continues, so acting on the first signal can mean repeated losses.
Check which oscillators and divergence types each one detects, whether it scans several symbols, how alerts are delivered and how often it has been updated. Several paid versions offer trials, so you can run one alongside a free tool on a single desktop chart before deciding.