
market session
Gösterge
869 i̇ndirmeler
Sürüm 1.0, Aug 2025
Windows, Mac
4.6
Değerlendirmeler: 6
Açıklama
📊 Piyasa Seansları Göstergesi
Piyasa Aktivite Analizi için Profesyonel Ticaret Seansları Göstergesi
📝 Açıklama
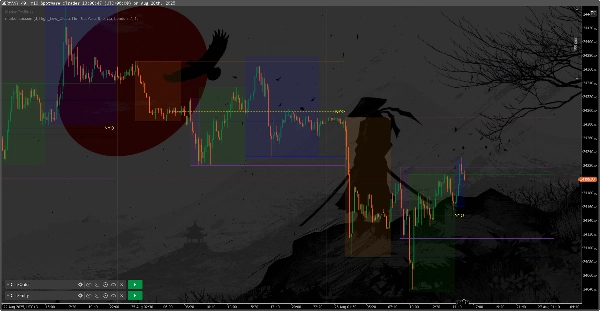
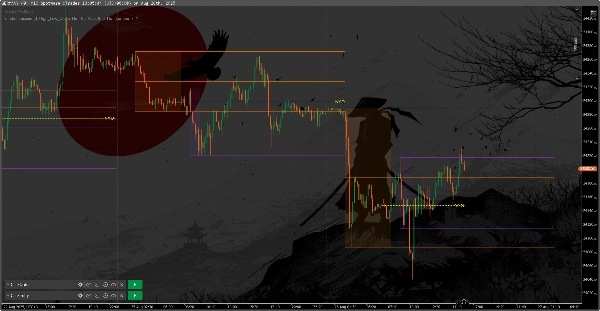
Market Sessions, grafiklerinizde ana ticaret seanslarını görselleştiren güçlü ve esnek bir göstergedir. Forex tüccarları için olduğu kadar, kripto paralar da dahil olmak üzere diğer finansal araçların ticareti için de idealdir.
✨ Temel Özellikler
🌏 Tam Ticaret Seansı Desteği
- Asya Seansı 🇯🇵 (Tokyo)
- Londra Seansı 🇬🇧 (Londra)
- New York Seansı 🇺🇸 (New York)
- Frankfurt Seansı 🇩🇪 (Frankfurt)
🎨 Esnek Görselleştirme
- 🎯 Her seans için renkli dikdörtgenler
- 📏 Uzantılı yatay Yüksek/Düşük/Orta çizgiler
- 🏷️ Özelleştirilebilir seans isimleri
- 🔧 Ayarlanabilir şeffaflık ve çizgi kalınlığı
⚙️ Gelişmiş Ayarlar
- 🕒 Her seans için özelleştirilebilir zamanlar
- 📅 Görüntülenecek gün sayısı (varsayılan 3)
- 🔄 Çizgi uzatma modu (Yok/Yüksek_Düşük/Yüksek_Düşük_Kapanış)
🟡 NYO (New York Açılışı) Çizgisi
- ⏰ New York Açılış çizgisinin gösterimi
- 🎨 Özelleştirilebilir çizgi rengi, stili ve kalınlığı
- 🔢 Ayarlanabilir NYO zamanı (varsayılan 04:00 UTC)
Özet
YZ özeti
The Market Session indicator visually delineates major global trading sessions on financial charts, supporting the Asian (Tokyo), London, New York, and Frankfurt sessions. Designed for forex and other markets including cryptocurrencies, it displays each session as colored rectangles with customizable session names. The indicator features horizontal lines marking session high, low, and mid levels, which can be extended according to user settings. Users can adjust session times, transparency, line thickness, and the number of days displayed (default is three). Additionally, it includes a customizable New York Open (NYO) line with adjustable time, color, style, and thickness. This tool aids traders in analyzing market activity by clearly identifying key trading periods and price levels associated with each session.
Gösterge profili
Müşteri değerlendirmeleri
4.6
Değerlendirmeler: 6
5 | 83 % | |
4 | 0 % | |
3 | 17 % | |
2 | 0 % | |
1 | 0 % |
Müşteri değerlendirmeleri
June 27, 2026
February 27, 2026
September 1, 2025
Very convenient and easy to use. Nothing extra, only the most necessary in the settings and on the chart. I recommend this indicator.
August 26, 2025
good indicator but its not clear though a little difficult to understand and the newyork open line seems tobe no where near the newyork session
Tartışma
SSS
cTrader Store üzerinden erişilebilen işlem botları, göstergeler ve eklentiler gibi ürünler, üçüncü taraf sağlayıcılar tarafından sağlanır ve yalnızca bilgilendirme ve teknik erişim amaçlarıyla sunulur. cTrader Store bir broker değildir ve yatırım tavsiyesi, kişisel öneriler vermez veya gelecekteki performansı garanti etmez.


Fiyat
Başlangıç 16/07/2025
869
Ücretsiz yüklemeler