Descripción
VISIÓN GENERAL
El indicador Balance of Power mide la fuerza de los compradores frente a los vendedores evaluando la capacidad de cada lado para llevar los precios a niveles extremos.
Introducido por Igor Levshin en la edición de agosto de 2001 de la revista Technical Analysis of Stocks & Commodities, BOP calcula la proporción del movimiento del precio dentro del rango de cada barra para revelar la dinámica de fuerza interna independiente de la dirección del precio.
CONCEPTO
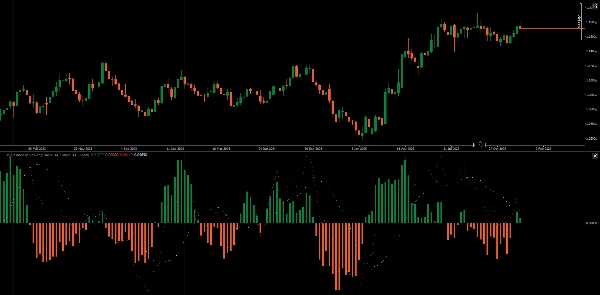
Balance of Power mide dónde cierra el precio dentro del rango de cada barra para revelar la batalla interna entre compradores y vendedores.
El principio subyacente es simple: los compradores empujan los precios hacia el máximo, los vendedores hacia el mínimo. Dónde cierra finalmente el precio dentro de ese rango revela quién dominó el período de negociación.
Los valores en bruto se suavizan usando un promedio móvil para reducir el ruido y revelar una presión direccional sostenida, transformando lecturas erráticas barra por barra en un indicador limpio de momentum que sigue los cambios en el control del mercado.
APLICACIÓN EN LA ESTRUCTURA DEL MERCADO
BOP proporciona un análisis de fuerza interna que puede confirmar o contradecir la estructura del precio:
Identificación de la Fase de Tendencia
- Tendencia alcista fuerte: BOP consistentemente por encima de cero con mínimos más altos
- Tendencia bajista fuerte: BOP consistentemente por debajo de cero con máximos más bajos
- Consolidación: BOP oscilando alrededor de la línea cero
- Zonas de transición: BOP rompiendo la estructura previa (máximo más alto/mínimo más bajo)
Confluencia de Soporte/Resistencia
- El retorno de BOP a cero a menudo coincide con que el precio pruebe niveles clave
- Lecturas extremas de BOP (+0.8 a +1.0 o -0.8 a -1.0) pueden indicar agotamiento cerca de la estructura
- La divergencia en niveles de estructura sugiere posible rechazo o ruptura
Distribución/Acumulación
- Precios en aumento con BOP en descenso: posible fase de distribución
- Precios en caída con BOP en aumento: posible fase de acumulación
- Estas divergencias son más significativas cerca de niveles importantes de estructura
ESTRATEGIA MULTI-TIMEFRAME
Usar BOP a través de diferentes marcos temporales proporciona contexto y precisión:
1. Marco Temporal Superior (HTF) - Sesgo Direccional:
- BOP diario/4H por encima de cero → buscar oportunidades de compra en marcos temporales inferiores
- BOP diario/4H por debajo de cero → buscar oportunidades de venta en marcos temporales inferiores
- Cruce de BOP HTF con cero → cambio importante de tendencia, esperar confirmación
2. Marco Temporal Inferior (LTF) - Momento de Entrada:
- BOP 1H/15M alineado con HTF → configuraciones de alta probabilidad
- Cruce BOP/Señal en LTF en dirección HTF → disparador de entrada
- Expansión del histograma LTF confirma momentum
3. Alineación de Marcos Temporales:
- Todos los marcos temporales en acuerdo → operaciones con mayor convicción
- HTF y LTF divergentes → esperar resolución o evitar la operación
- Reversión LTF contra HTF → posible scalp contratrend solo
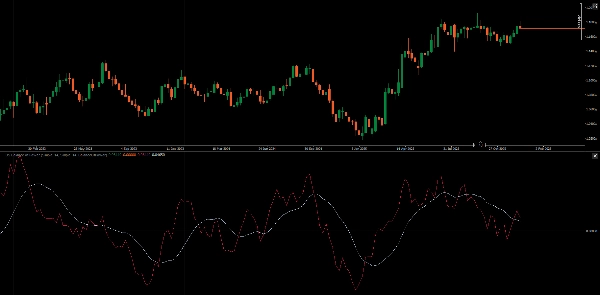
LÍNEA DE SEÑAL & HISTOGRAMA
Línea de Señal (MA de BOP):
- Los cruces BOP/Señal proporcionan señales filtradas de entrada/salida
- La pendiente de la línea de señal indica persistencia del momentum
- La distancia entre BOP y Señal muestra la extensión del movimiento
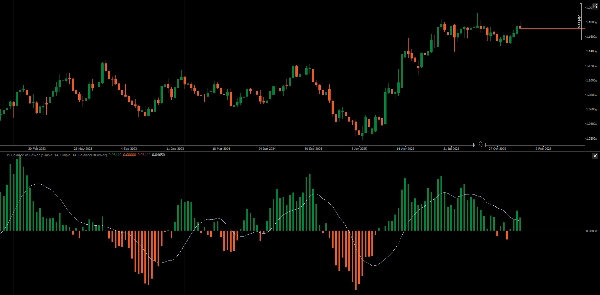
Modos del Histograma:
- Modo Valor: Muestra la polaridad de BOP relativa a cero (dominancia comprador/vendedor)
- Modo Señal: Muestra la diferencia BOP - Señal, revelando cambios de momentum antes que los cruces
En modo Señal, los cruces del histograma con la línea cero ocurren antes que los cruces de BOP/Línea de Señal, ofreciendo una advertencia temprana de cambio de momentum.
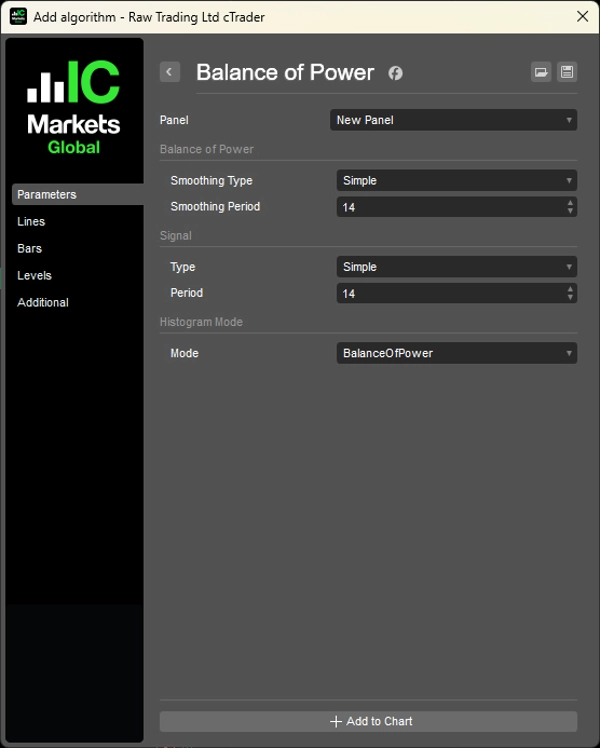
CARACTERÍSTICAS
- Período de Suavizado: Período MA ajustable para BOP (por defecto 14)
- Tipo de Suavizado: Elección de tipos de MA (SMA, EMA, etc.)
- Período de Señal: Período MA ajustable para la línea de Señal (por defecto 14)
- Tipo de Señal: Elección de tipos de MA para la línea de Señal
- Modo Histograma: Alternar entre visualización de Valor y diferencia de Señal
EJEMPLO PRÁCTICO
- HTF (Diario): BOP por encima de cero y en aumento → sesgo alcista
- El precio retrocede hacia el soporte
- LTF (1H): BOP cruza por encima de Señal → disparador de entrada
- Histograma (modo Señal) se expande → confirma aceleración del momentum
- Salir cuando el histograma LTF se contrae o BOP cruza por debajo de Señal
__________________________________________________________________________________________
MÁS INDICADORES GRATUITOS
Explora una amplia gama de herramientas de análisis de mercado — desde estructura y volumen hasta regresión, volatilidad y marcos temporales personalizados.
El código fuente está disponible en el repositorio de GitHub repository.
Todos son gratuitos para usar. Pero si deseas apoyar con un café, puedes hacerlo aquí.
Soporte/Resistencia
Volumen
- Perfilador de Actividad de Volumen
- Analizador de Eficiencia de Volumen
- Análisis de Perfil de Volumen
- Perfil de Volumen - Actualizado
- Análisis de Spread de Volumen
- VWAP (Precio Promedio Ponderado por Volumen)
Medias Móviles
- Canal SSL
- Media Móvil Anclada
- Media Móvil Escalada por Desviación
- Activador Gann High Low
- Línea de Tendencia Instantánea
- MA Adaptativa de Kaufman con Visión de Tendencia
- Canal de Media Móvil
- Suite de Medias Móviles
- Media Móvil de Canal de Tendencia
Utilidades/Personalizados
Basado en Regresión
Volatilidad
Osciladores
__________________________________________________________________________________________
DESCARGO DE RESPONSABILIDAD
El trading implica riesgos. Este indicador está destinado solo para análisis técnico — siempre aplique una gestión adecuada del riesgo y opere responsablemente.
RETROALIMENTACIÓN Y MEJORAS
Si tienes sugerencias, solicitudes de funciones o ideas para mejoras, por favor deja un comentario en la pestaña de Discusión. Tu retroalimentación ayuda a mejorar el indicador para todos.
Resumen
Key functionalities include identifying trend phases—strong uptrends, downtrends, consolidation, and transition zones—by observing BOP behavior relative to the zero line. It also aids in detecting support and resistance confluence, with extreme BOP readings indicating potential exhaustion near key levels and divergences signaling possible rejections or breakthroughs. The indicator helps identify distribution and accumulation phases through price and BOP divergences.
BOP supports multi-timeframe analysis: higher timeframes provide directional bias, while lower timeframes offer entry timing signals via BOP and signal line crossovers and histogram momentum confirmation. The signal line is a moving average of BOP, with crossovers serving as filtered entry/exit triggers. The histogram can display either BOP polarity or the difference between BOP and its signal line, offering early momentum shift warnings.
Adjustable parameters include smoothing periods and types for both BOP and signal lines, and histogram display modes. The indicator is applicable across Forex, indices, commodities, cryptocurrencies, and stocks markets.