Market Swing Structure Pullback Pro
指标
版本 1.0, Sep 2025
Windows 版、Mac 版
说明
“交易涉及风险。过去的表现并不保证未来的结果。”
摘要
AI 摘要
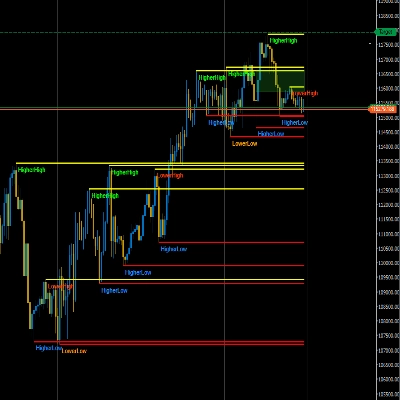
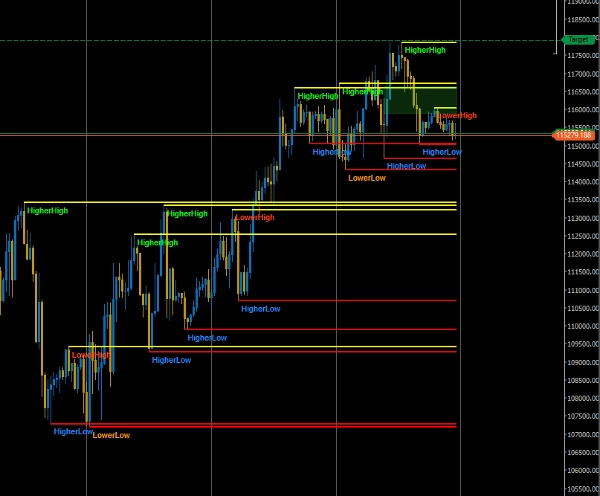
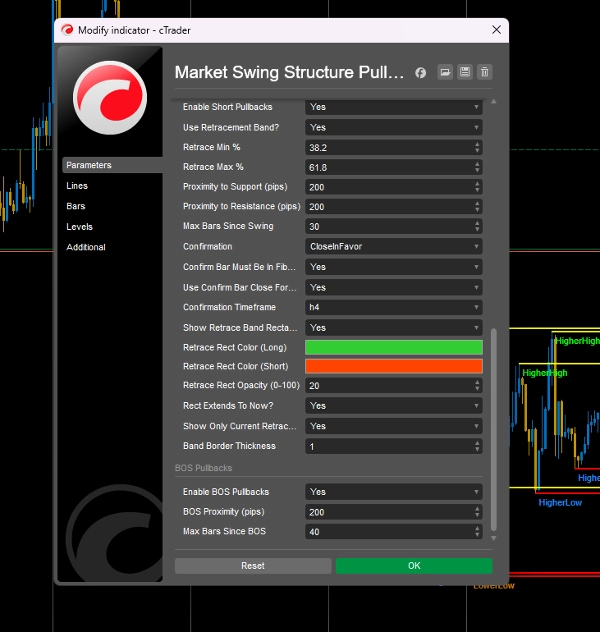
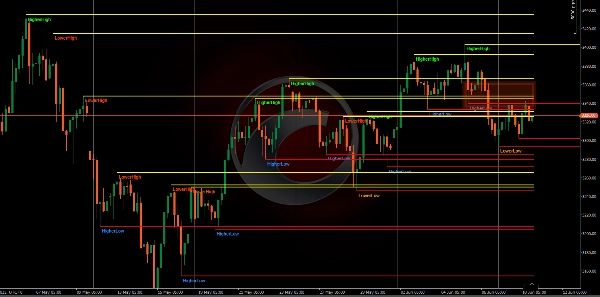
Market Swing Structure Pullback Pro is a trading indicator designed to automatically detect key market levels such as support and resistance and structural points. It highlights pullbacks and break of structure (BOS) retests, providing visual cues for potential trade entries. The indicator incorporates candle confirmation to filter signals, aiming to improve the accuracy of trade setups. It supports multiple markets including Forex, cryptocurrencies (e.g., BTCUSD, ETH), commodities (e.g., gold, oil), indices (e.g., NAS100, SP500), and stocks. Key features include automatic identification of swing structures, highlighting of pullback zones, and integration of candle pattern validation. This tool is intended for use on various symbols and timeframes to assist traders in identifying potential reversal or continuation points based on market structure analysis.
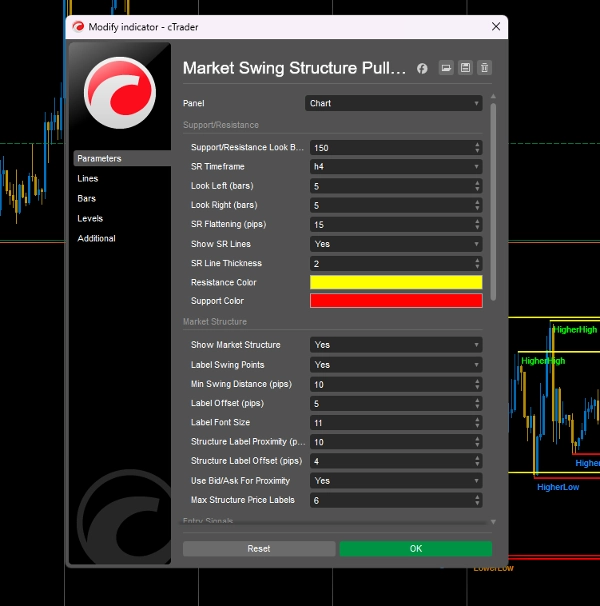
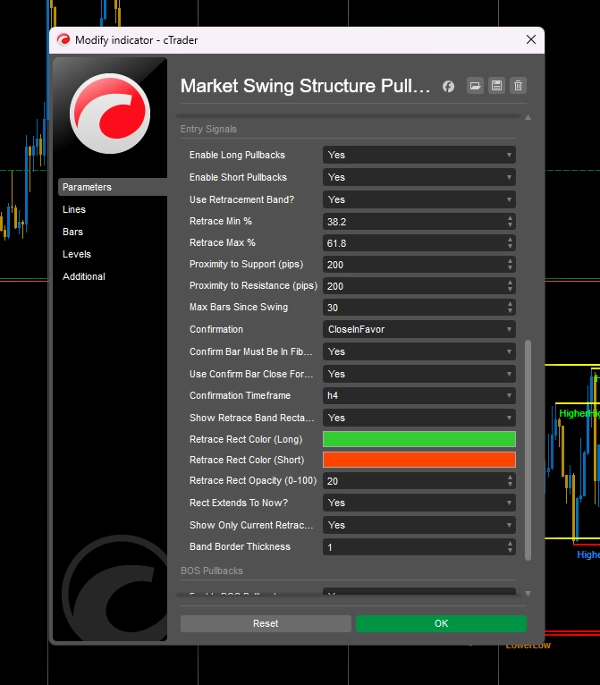
指标配置
客户评价
0.0
评价:0
客户评价
该产品尚无评价。已经试过了?抢先告诉其他人!
讨论
常见问答
BTCUSD
Forex
Signal
Breakout
Indices
EURUSD
Commodities
GBPUSD
NZDUSD
Prop
Supertrend
Crypto
Stocks
XAUUSD
NAS100
USDJPY
cTrader Store 提供的所有产品,包括交易机器人、指标和插件,均由第三方开发者提供,仅供信息参考和技术访问之用。cTrader Store 并非经纪商,不提供投资建议、个人推荐或任何未来业绩保证。


价格
注册日期 31/10/2024
56
销售
1.75K
免费安装