Opis
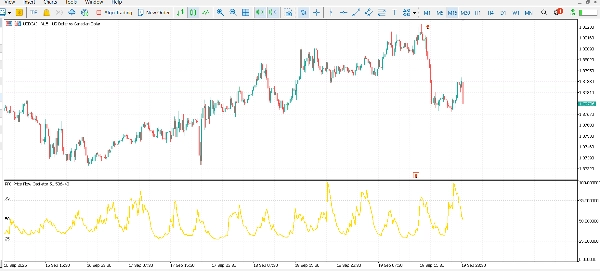
Oscylator Przepływu Ceny PFO to narzędzie analizy technicznej zaprojektowane, aby dostarczyć traderom uporządkowany obraz momentum i zmienności rynku. Łączy kilka czynników rynkowych w jeden znormalizowany oscylator, pozwalając użytkownikom na wyraźniejszą interpretację ruchów cen w różnych warunkach. Wskaźnik jest bezpłatny i może być stosowany na rynku Forex, surowcach, indeksach oraz innych aktywach.
Jak to działa
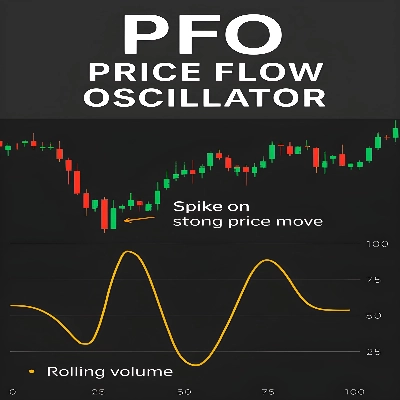
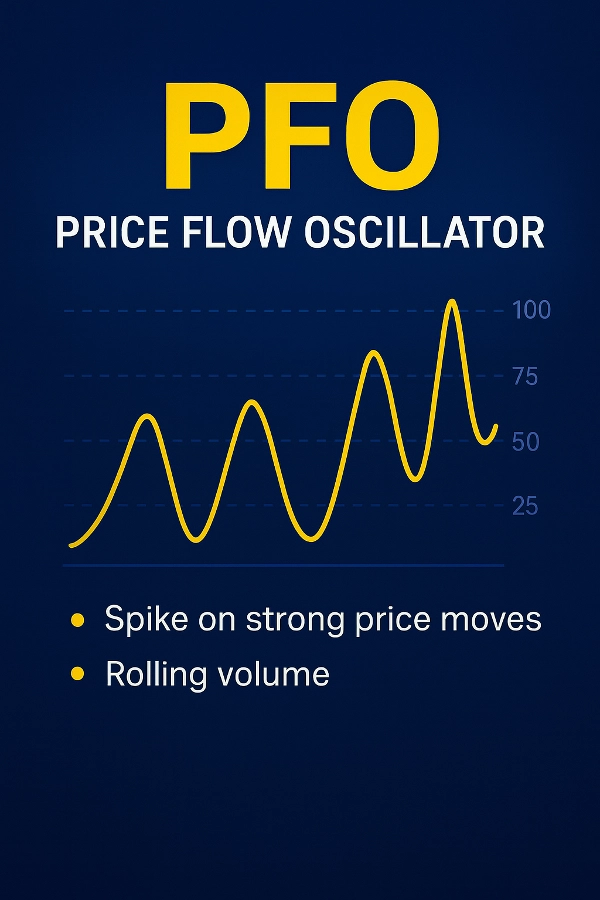
Oscylator PFO oblicza znormalizowaną wartość (0–100) na podstawie:
ATR (Average True Range): Skaluje odczyty zgodnie ze zmiennością rynku.
Średnie kroczące (EMA/SMA): Dostarczają bazę trendu do porównania momentum.
Analiza wolumenu: Porównuje bieżącą aktywność z średnimi kroczącymi, aby uwydatnić silniejsze ruchy.
Czynniki Price Action:
Wielkość korpusu względem zakresu (siła świecy).
Analiza knotów (presja kupna/sprzedaży).
Kierunkowe nastawienie (ruch byczy vs. niedźwiedzi).
Momentum vs. ATR: Mierzy odchylenie od trendu względem zmienności.
Ważenie ruchu cenowego: Podkreśla istotne zmiany między kolejnymi słupkami.
Wygładzanie i normalizacja: Filtruje szumy i standaryzuje wyniki na skali 0–100.
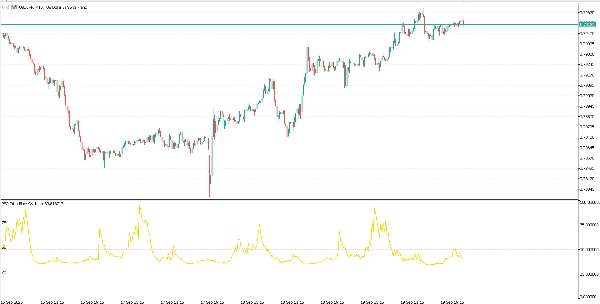
Odczytywanie oscylatora
Powyżej 75: Wskazuje na silniejsze warunki bycze.
Poniżej 25: Wskazuje na silniejsze warunki niedźwiedzie.
W okolicach 50: Sugeruje neutralne lub konsolidujące zachowanie rynku.
Kluczowe cechy
Podejście wieloczynnikowe: integruje zmienność, trend, wolumen i price action.
Wartości wygładzone dla przejrzystości i redukcji szumów.
Adaptacyjne skalowanie dostosowujące się do różnych warunków rynkowych.
Działa na wielu klasach aktywów i ramach czasowych.
Zastrzeżenie: Ten wskaźnik jest przeznaczony wyłącznie do celów analizy technicznej. Nie przewiduje przyszłych wyników ani nie gwarantuje rezultatów handlowych. Użytkownicy powinni łączyć go z własną analizą i praktykami zarządzania ryzykiem.
Podsumowanie
Opinie klientów
5 | 0 % | |
4 | 100 % | |
3 | 0 % | |
2 | 0 % | |
1 | 0 % |