Opis
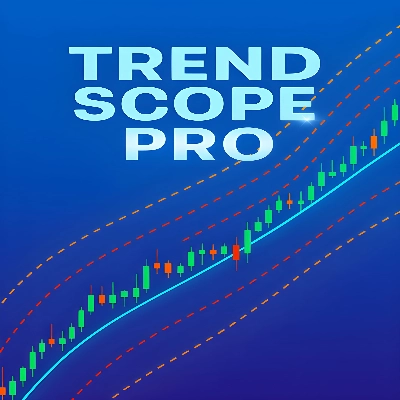
Trend Scope Pro to profesjonalny wskaźnik techniczny zaprojektowany, aby dać traderom głębsze zrozumienie struktury rynku i kierunku cen. Opierając się na zaawansowanych algorytmach regresji liniowej, to narzędzie oblicza dynamiczną linię regresji wraz z trzema poziomami kanałów odchylenia standardowego. Łącząc dokładność statystyczną z wizualną przejrzystością, pomaga łatwo zidentyfikować aktualne trendy rynkowe, potencjalne strefy odwrócenia oraz zakresy zmienności, czyniąc go dostępnym, a jednocześnie potężnym dodatkiem do każdego zestawu narzędzi tradingowych.
Jak czytać Trend Scope Pro
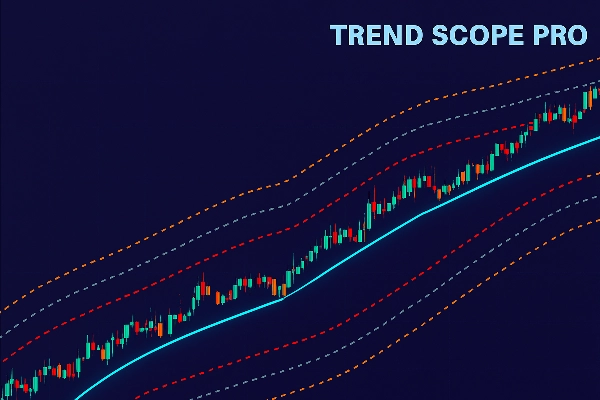
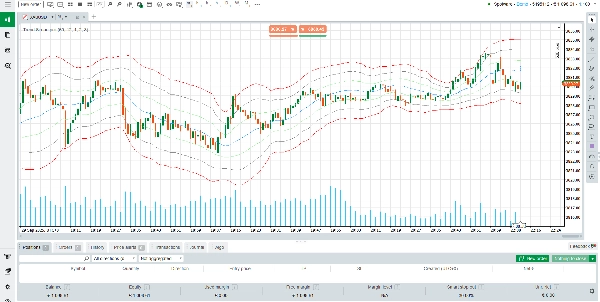
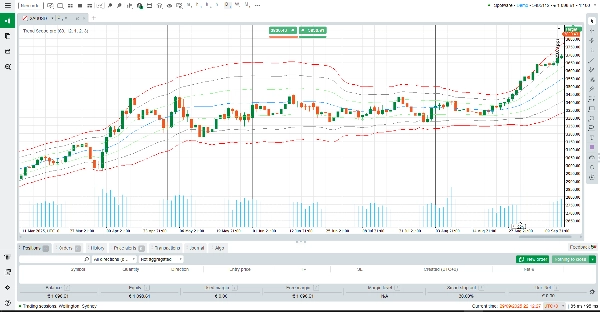
Po zastosowaniu na wykresie, Trend Scope Pro rysuje centralną linię regresji (niebieską), która reprezentuje „uczciwą wartość” lub średni kierunek trendu w określonym okresie. Wokół tej linii wykreślane są trzy zestawy górnych i dolnych kanałów (pomarańczowy, szary i czerwony). Każdy kanał jest obliczany przy użyciu innego mnożnika odchylenia standardowego:
Górny/Dolny 1 (Pomarańczowy): Reprezentuje pierwsze odchylenie standardowe. Ruchy cen w tej strefie często odzwierciedlają normalną krótkoterminową zmienność.
Górny/Dolny 2 (Szary): Oznacza silniejsze odchylenia. Dotarcie do tej strefy często sygnalizuje przedłużony ruch lub rozwijający się impet.
Górny/Dolny 3 (Czerwony): Ekstremalne strefy, gdzie rynek może być wykupiony lub wyprzedany, tworząc potencjalne okazje do odwrócenia.
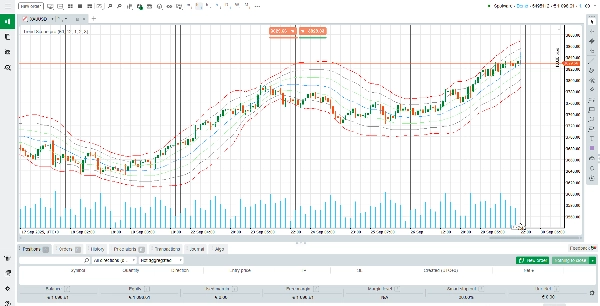
W praktyce traderzy mogą używać linii regresji do potwierdzania kierunku trendu, podczas gdy kanały działają jako dynamiczne poziomy wsparcia i oporu. Na przykład:
Jeśli cena konsekwentnie utrzymuje się powyżej linii regresji, trend jest wzrostowy.
Jeśli cena wielokrotnie testuje lub przebija linię regresji od dołu, trend słabnie.
Ekstremalne dotknięcia czerwonych kanałów mogą wskazywać punkty wyczerpania, gdzie odwrócenia lub cofnięcia są bardziej prawdopodobne.
Jak działa wskaźnik
Trend Scope Pro oblicza linię regresji, analizując ceny zamknięcia w wybranym okresie wstecznym. Następnie mierzy odchylenie standardowe ceny od tej linii, co determinuje szerokość każdego kanału. To statystyczne podejście zapewnia, że wskaźnik dostosowuje się do zmienności w czasie rzeczywistym, oferując równowagę między sygnałami podążania za trendem a wskazówkami dotyczącymi powrotu do średniej.
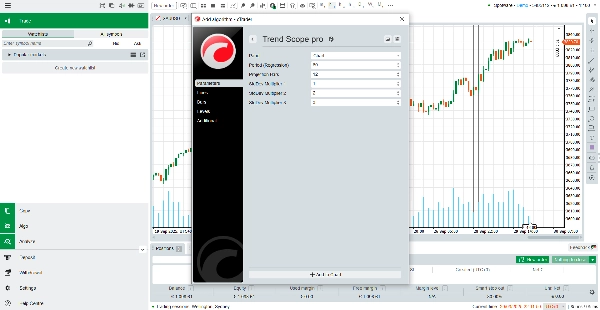
Domyślne ustawienia (60 słupków wstecz, mnożniki 1.0, 2.0, 3.0) są zoptymalizowane dla większości instrumentów, ale można je łatwo dostosować do swojej strategii lub ram czasowych. Niezależnie od tego, czy jesteś day traderem szukającym wejść intraday, czy swing traderem analizującym szersze cykle rynkowe, Trend Scope Pro dostarcza wiarygodny kontekst do podejmowania decyzji.
Kluczowe cechy Trend Scope Pro
Adaptacyjna regresja liniowa – Dynamicznie oblicza centralny trend rynkowy dla precyzyjnego określenia kierunku.
Kanały wielopoziomowe – Trzy zestawy pasm odchylenia pomagają identyfikować normalne ruchy, silne trendy i ekstremalne warunki.
Wizualna przejrzystość – Czyste i kolorowe linie ułatwiają interpretację ruchu cen na pierwszy rzut oka.
Konfigurowalne ustawienia – Elastyczne okresy wsteczne i mnożniki odchylenia, aby dopasować się do każdego stylu handlu.
Podsumowując, Trend Scope Pro łączy statystyczną niezawodność z praktyczną użytecznością. To nie tylko linia trendu – to kompletny system do analizy zachowania cen, identyfikacji stref o wysokim prawdopodobieństwie oraz poprawy timingu transakcji. Niezależnie od tego, czy szukasz potwierdzenia trendu, przewidujesz odwrócenia, czy po prostu dodajesz strukturę do swoich wykresów, Trend Scope Pro oferuje jasność i pewność, której potrzebujesz.
Podsumowanie
Opinie klientów
5 | 50 % | |
4 | 50 % | |
3 | 0 % | |
2 | 0 % | |
1 | 0 % |


![Logo „[Stellar Strategies] Inside Bar with Signals”](https://cdn.ctrader.com/image/webp/1d9e8bfa-3b2c-4440-bb37-5856902008a7_30683)


