
Dynamic Trend Flux
Wskaźnik
Wersja 1.0, Nov 2025
Windows, Mac
4.0
Opinie: 1
Opis
Dynamiczny Przepływ Trendu
Typ: oscylator momentum / trendu (w stylu MACD, wielokolorowy)
Co robi
Dynamiczny Przepływ Trendu to kolorowy oscylator momentum oparty na klasycznej różnicy szybkiej/wolnej EMA oraz linii sygnału.
Pomaga szybko zobaczyć:
- kiedy momentum jest bycze lub niedźwiedzie,
- czy momentum wzmacnia się lub słabnie,
- oraz gdzie następują zmiany trendu (przecięcia linii głównej i sygnału).
Wskaźnik rysuje:
- Linię główną (linia Flux)
-
- zbudowaną z różnicy między szybką a wolną EMA
- zmienia kolor w zależności od tego, czy jest powyżej czy poniżej linii sygnału (opcjonalnie).
- Linię sygnału
-
- średnią kroczącą linii głównej, używaną jako łagodniejszy wyzwalacz.
- Histogram w 4 kolorach (opcjonalnie)
-
- pokazuje odległość między linią główną a sygnałem,
- kolor koduje zarówno kierunek (powyżej/poniżej zera) jak i zmianę siły z słupka na słupek.
- Kropki na przecięciach (opcjonalnie)
-
- podkreśla miejsca, gdzie linia główna przecina linię sygnału → potencjalne zmiany fazy trendu.
Wszystkie obliczenia wykonywane są na bieżącym interwale wykresu.
Jak to czytać
1. Linia zerowa
- Wartości powyżej zera → dominuje presja byków.
- Wartości poniżej zera → dominuje presja niedźwiedzi.
2. Kolorowy histogram
Przy włączonym trybie 4 kolorów:
- Aqua → powyżej zera i rośnie
-
- silne / rosnące bycze momentum.
- Niebieski → powyżej zera, ale spada
-
- trend byczy nadal trwa, ale momentum słabnie.
- Czerwony → poniżej zera i spada
-
- silne / rosnące niedźwiedzie momentum.
- Bordowy → poniżej zera, ale rośnie
-
- faza niedźwiedzia nadal trwa, ale momentum traci na sile.
To znacznie ułatwia wizualne dostrzeganie dywergencji i zmian momentum.
3. Linie główna i sygnału
- Linia główna powyżej sygnału → faza bycza.
- Linia główna poniżej sygnału → faza niedźwiedzia.
Jeśli włączona jest zmiana koloru:
- Linia główna Limonkowa = powyżej sygnału (kontrola bycza)
- Linia główna Czerwona = poniżej sygnału (kontrola niedźwiedzia)
4. Kropki na przecięciach
- Zielona kropka (przecięcie w górę) → linia główna przecina powyżej sygnału
-
- możliwy początek byczego ruchu.
- Czerwona kropka (przecięcie w dół) → linia główna przecina poniżej sygnału
-
- możliwy początek niedźwiedziego ruchu.
Zawsze łącz te sygnały ze strukturą / akcją cenową oraz kontekstem wyższego interwału.
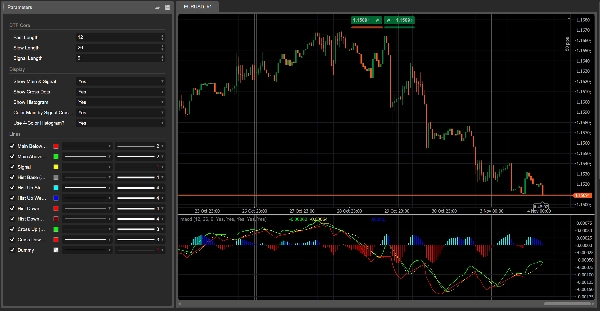
Parametry (angielski)
Rdzeń DTF
- Szybka długość – okres szybkiej EMA (domyślnie 12).
- Wolna długość – okres wolnej EMA (domyślnie 26).
- Długość sygnału – okres SMA sygnału stosowanego do linii głównej (domyślnie 9).
Wyświetlanie
- Pokaż linię główną i sygnału – przełącza dwie linie.
- Pokaż kropki na przecięciach – pokazuje kropki na przecięciach linii głównej i sygnału.
- Pokaż histogram – przełącza widoczność histogramu w tle.
- Koloruj linię główną według przecięcia sygnału?
-
- WŁĄCZONE → linia główna Limonkowa powyżej sygnału, Czerwona poniżej.
- WYŁĄCZONE → linia główna pozostaje Czerwona.
- Używać 4-kolorowego histogramu?
-
- WŁĄCZONE → logika aqua / niebieski / czerwony / bordowy.
- WYŁĄCZONE → histogram w jednym szarym kolorze.
Podsumowanie
Profil wskaźnika
Opinie klientów
4.0
Opinie: 1
5 | 0 % | |
4 | 100 % | |
3 | 0 % | |
2 | 0 % | |
1 | 0 % |
Dyskusja
Częste pytania
Signal
Indices
Commodities
GBPUSD
RSI
Bollinger
Fibonacci
Scalping
AI
XAUUSD
NAS100
MACD
BTCUSD
Forex
Breakout
EURUSD
NZDUSD
Martingale
Prop
ZigZag
Supertrend
Fair Value Gap
SMC
Crypto
Grid
Stocks
ATR
USDJPY
VWAP
Produkty dostępne za pośrednictwem cTrader Store, w tym boty handlowe, wskaźniki i wtyczki, dostarczane są przez deweloperów zewnętrznych i udostępniane wyłącznie w celach informacyjnych oraz w celu zapewnienia dostępu technicznego. cTrader Store nie jest brokerem i nie zapewnia doradztwa inwestycyjnego, nie udziela spersonalizowanych rekomendacji ani nie gwarantuje przyszłych wyników.


Cena
42.11M
Wolumen transakcji
6.13M
Zysk w pipsach
222
Sprzedaż
8.38K
Bezpłatne instalacje