📈 Wskaźnik Skew Volatility Bias – Wersja Profesjonalna (dla cTrader)
Odkryj głębsze zrozumienie presji rynkowej, nierównowagi zmienności i kierunkowej pewności dzięki Wskaźnikowi Skew Volatility Bias, ulepszonej wersji klasycznego podejścia opartego na zmienności, pierwotnie inspirowanego Pine Script, a teraz w pełni zoptymalizowanego dla cTrader.
To narzędzie pomaga traderom wizualizować która strona rynku uderza mocniej — kupujący czy sprzedający — poprzez pomiar asymetrii zmienności i przekształcenie jej w jasny, łatwy do odczytania sygnał.
Niezależnie od tego, czy handlujesz indeksami, forexem, towarami czy kryptowalutami, ten wskaźnik służy jako potężny filtr trendu, detektor reżimu i narzędzie potwierdzające bias.
1. Co mierzy wskaźnik Skew
Wskaźnik ocenia równowagę zmienności między świecami byczymi a niedźwiedziymi.
Oblicza znormalizowany True Range i wprowadza go do dwóch adaptacyjnych średnich:
- Deviation Max → zmienność generowana podczas świec wzrostowych
- Deviation Min → zmienność generowana podczas świec spadkowych
Następnie oblicza:
👉 Skew = DeviationMax / DeviationMin
To przekształca surową zmienność w jasny odczyt kierunkowy:
- Skew > 1 → ruchy wzrostowe są średnio silniejsze
- Skew < 1 → ruchy spadkowe są silniejsze
- Skew ≈ 1 → zmienność jest symetryczna, a rynek zrównoważony
Krótko mówiąc:
Skew ujawnia, która strona ma „dominację zmienności”.
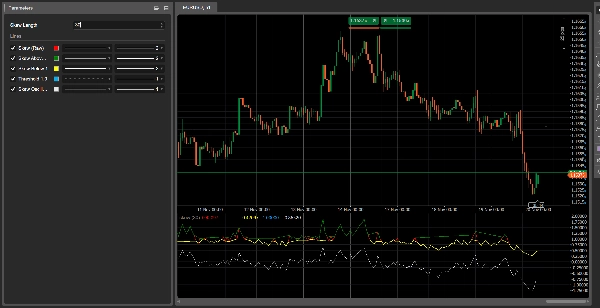
2. Zrozumienie linii
1. Skew (surowy) – Czerwona linia
Czysty stosunek zmienności. To jest główny sygnał.
2. Skew powyżej 1 – Zielona linia
Pokazuje dominację zmienności byczej.
3. Skew poniżej 1 – Żółta linia
Pokazuje dominację zmienności niedźwiedziej.
4. Linia progu 1.0 – Niebieska linia przerywana
Reprezentuje równowagę.
5. Oscylator Skew (log) – Biała linia
Bardziej stabilna, gładsza reprezentacja:
- powyżej 0 = bycza zmienność
- poniżej 0 = niedźwiedzia zmienność
3. Jak to czytać
A) Reżimy rynkowe
🔹 Reżim byczy
- Skew > 1
- Aktywna zielona linia
- Oscylator powyżej zera
→ Rynek sprzyja pozycjom długim.
🔹 Reżim niedźwiedzi
- Skew < 1
- Aktywna żółta linia
- Oscylator poniżej zera
→ Rynek sprzyja pozycjom krótkim.
🔹 Neutralny
- Skew ≈ 1
→ Rynek zrównoważony, odpowiedni do handlu w zakresie.
4. Sygnały zmiany reżimu
Skew przekracza 1 w górę
→ Kupujący zyskują dominację zmienności
→ Przejście w trend byczy
Skew przekracza 1 w dół
→ Sprzedający zyskują dominację zmienności
→ Przejście w trend niedźwiedzi
Te zmiany często występują przed potwierdzeniem trendu przez ruch cenowy, co czyni Skew potężnym wczesnym wskaźnikiem.
5. Praktyczne zastosowania
1️⃣ Filtr trendu dla cBots
- handluj długie pozycje tylko gdy SkewOsc > 0
- handluj krótkie pozycje tylko gdy SkewOsc < 0
2️⃣ Potwierdzenie jakości trendu
- Trend wzrostowy + Skew > 1 = silny trend
- Trend wzrostowy + Skew spadający w kierunku 1 = słabnący trend
3️⃣ Sentiment rynku / filtr ryzyka
Szczególnie skuteczny na indeksach i głównych parach walutowych FX.
6. Podsumowanie
- Co pokazuje: dominację zmienności
- Dlaczego to ważne: zmiany zmienności poprzedzają zmiany cen
- Jak go używać: jako filtr, narzędzie potwierdzające lub wskaźnik sentymentu
- Najlepsze cechy: niezwykle lekki, szybki i elastyczny
5 | 67 % | |
4 | 33 % | |
3 | 0 % | |
2 | 0 % | |
1 | 0 % |