Opis
TrendFallowing: to zaawansowany wskaźnik techniczny dla platformy cTrader, który łączy wiele podejść analitycznych w jedno rozwiązanie. Stworzony dla traderów poszukujących potwierdzenia trendu poprzez zbieżność wskaźników, oferuje pełny obraz rynku z precyzyjnymi sygnałami i filtrami walidacyjnymi.
OBEJRZYJ WIDEO WPROWADZAJĄCE O STRATEGII OPERACYJNEJ!
🎯 STRATEGIE UŻYCIA
1. Trading podążający za trendem
Zastosowanie: Identyfikacja i podążanie za ustalonymi trendami
Interwał czasowy: H4, D1 dla dłuższych pozycji
Ustawienia: ADX > 25, wolumen powyżej średniej
Zarządzanie ryzykiem: Stop-loss poniżej 50-okresowej średniej kroczącej
2. Swing Trading
Zastosowanie: Wykorzystanie ruchów średnioterminowych
Interwał czasowy: H1, H4
Ustawienia: Włączony filtr wolumenu, potwierdzenie przez Volume Profile
Cele: Volume Profile POC jako TP
3. Trading na wybiciach
Zastosowanie: Wejście przy wybiciach wsparcia/oporu
Ustawienia: Wolumen PVA do potwierdzenia siły ruchu
Potwierdzenie: Wzrost ADX + wolumen powyżej średniej
4. Scalping (krótsze interwały)
Zastosowanie: Szybkie transakcje z wieloma potwierdzeniami
Interwał czasowy: M1, M5
Ustawienia: Surowe filtry wolumenu i Momentum
🔧 JAK DZIAŁAJĄ WSKAŹNIKI
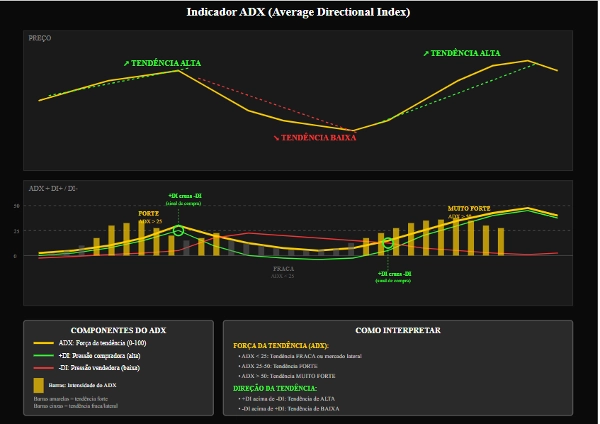
RDZENNY ADX & DI
ADX (Average Directional Index)
Funkcja: Pomiar siły trendu
Interpretacja:
0-25: Słaby trend/ruch boczny
25-50: Silny trend
50+: Bardzo silny trend
Praktyczne użycie: Unikać transakcji gdy ADX < 20
+DI / -DI (wskaźniki kierunkowe)
+DI: Siła kupujących
-DI: Siła sprzedających
Sygnał: Przecięcie +DI powyżej -DI (kupno) i odwrotnie
Nachylenie ADX (ADX Slope)
Funkcja: Pomiar przyspieszenia trendu
Wykres: Cyjanowy histogram
Sygnał: Dodatnie wartości wskazują na wzmacniający się trend
FILTRY WOLUMENU
Filtr MA wolumenu
Funkcja: Walidacja sygnałów wolumenem powyżej średniej
Parametry: Okres 20, Mnożnik 1.0
Użycie: Potwierdzenie zainteresowania instytucjonalnego
Wolumen PVA (Price Volume Analysis)
Kolory i znaczenie:
Zielony: Kupno z bardzo wysokim wolumenem (>150% średniej)
Niebieski: Kupno z wysokim wolumenem
Czerwony: Sprzedaż z bardzo wysokim wolumenem
Różowy: Sprzedaż z wysokim wolumenem
Żółty: Pin Bar/wyczerpanie z wybiciem wsparcia
VOLUME PROFILE
POC (Point of Control)
Funkcja: Cena z najwyższym obrotem
Użycie: Naturalny cel dla transakcji, dynamiczne wsparcie/opór
Obszar wartości
Funkcja: Strefa, w której handlowano 70% wolumenu
Interpretacja:
Cena powyżej: Trend wzrostowy
Cena poniżej: Trend spadkowy
W środku: Możliwy ruch boczny
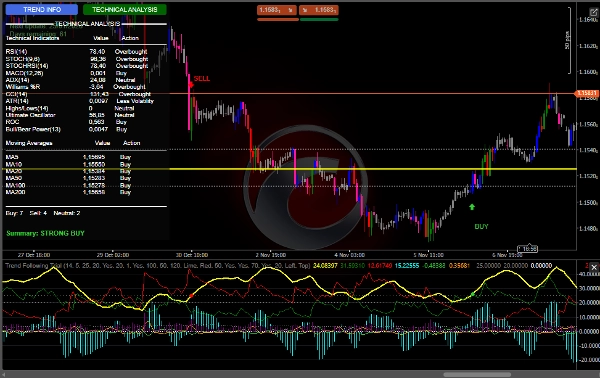
Panel wskaźników
RSI: Wyprzedany (<30) / wykupiony (>70)
MACD: Momentum
Williams %R: Ekstremalne warunki
CCI: Identyfikacja odwrócenia
Stochastic: Krótkoterminowe Momentum
Ultimate Oscillator: Momentum wielointerwałowe
Średnie kroczące
Pełny zestaw MA (5, 10, 20, 50, 100, 200)
Analiza wyrównania dla trendów
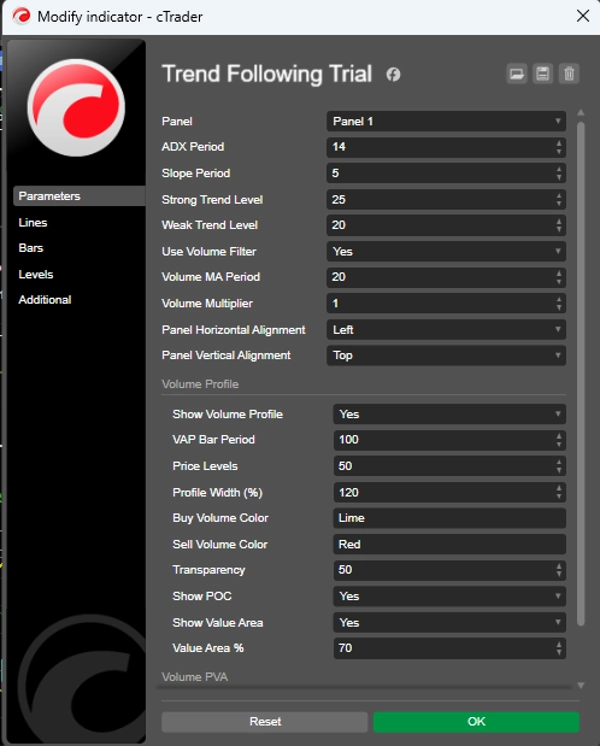
⚙️ ZALECANE USTAWIENIA
Ustawienia konserwatywne
Okres ADX: 14
Okres nachylenia: 5
Poziom silnego trendu: 25
Poziom słabego trendu: 20
Użyj filtru wolumenu: true
Okres MA wolumenu: 20
Mnożnik wolumenu: 1.2
Ustawienia agresywne
Okres ADX: 10
Okres nachylenia: 3
Poziom silnego trendu: 20
Poziom słabego trendu: 15
Użyj filtru wolumenu: true
Okres MA wolumenu: 14
Mnożnik wolumenu: 1.0
Volume Profile (zalecane)
Pokaż Volume Profile: true
Okres słupka VAP: 100
Poziomy cenowe: 50
Procent obszaru wartości: 70
Pokaż POC: true
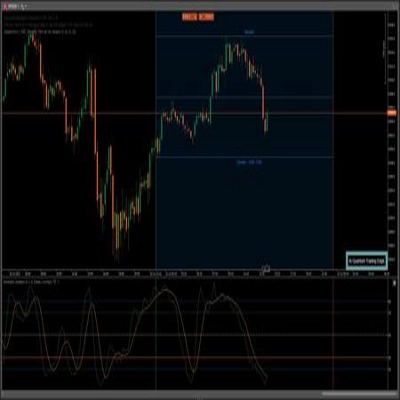
🎨 ZASOBY WIZUALNE
Interfejs użytkownika
Panel dynamiczny: Informacje w czasie rzeczywistym
Przyciski interaktywne: Przełączanie między analizami
Intuicyjne kolory: Kodowanie funkcjonalne
Sygnały graficzne
Strzałki: wejścia KUP/SPRZEDAJ
Dźwięki: Słyszalne alerty
Kolory słupków: Zintegrowana analiza PVA