
Opis
Czym jest krzywa Coppocka?
Krzywa Coppocka to długoterminowy wskaźnik momentum, pierwotnie zaprojektowany do identyfikacji głównych dołków na rynku S&P 500. Został stworzony w 1962 roku przez ekonomistę Edwina Coppocka, który został poproszony przez Kościół Episkopalny o znalezienie niskiego ryzyka okazji zakupowych dla ich funduszu.
Mówiąc prosto, jest to oscylator podążający za trendem, który informuje, kiedy rynek niedźwiedzia prawdopodobnie osiągnął dno, a nowy rynek byka się zaczyna.
„Sekretna receptura” (Jak to działa)
W przeciwieństwie do wielu wskaźników, które są nerwowe i reaktywne, krzywa Coppocka jest celowo powolna. Oblicza się ją, biorąc ważoną średnią kroczącą (WMA) sumy dwóch różnych wskaźników zmiany (ROC).
Coppock = WMA(10) z (ROC(14) + ROC(11))
Logika:
Mierzy tempo zmiany momentum cenowego na długich okresach (zwykle 11 i 14 miesięcy). Poprzez wygładzanie tych danych za pomocą średniej ważonej, filtruje niemal cały krótkoterminowy szum rynkowy.
Ciekawostka:
Coppock podobno pytał biskupów, ile czasu zajmuje człowiekowi odzyskanie równowagi po stracie bliskiej osoby. Odpowiedzieli „11 do 14 miesięcy”. Zastosował te same ramy czasowe do rynku, uznając, że psychologia rynku podąża za podobnym cyklem żałoby i odzyskiwania równowagi.
Dlaczego jest przydatny?
Traderzy i inwestorzy cenią krzywą Coppocka z trzech głównych powodów:
- Filtruje szum: Ponieważ jest obliczana na podstawie miesięcznych ram czasowych (tradycyjnie), ignoruje zmienność z dnia na dzień lub nawet z tygodnia na tydzień. Nie wyzwala sygnałów często, ale gdy to robi, są one zwykle istotne.
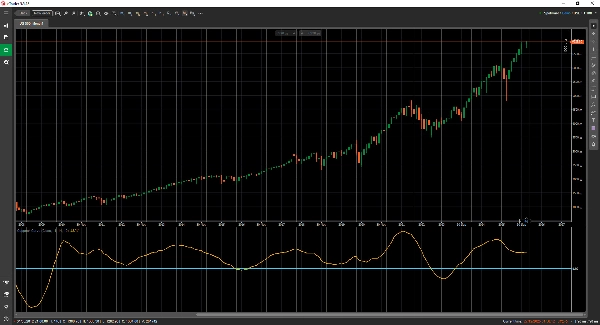
- Wyraźne sygnały kupna: Sygnał jest binarny i łatwy do odczytania. Sygnał „Kup” generowany jest, gdy krzywa znajduje się poniżej linii zerowej i zaczyna rosnąć.
- Kotwica psychologiczna: Zapobiega próbom „łapania spadającego noża”. Zmusza do czekania, aż momentum matematycznie przejdzie z ujemnego na dodatnie, zanim zajmie się pozycję.
Kiedy go używać
- Najlepiej do: Inwestowania długoterminowego, alokacji emerytalnych oraz identyfikacji początku nowego rynku byka.
- Nie do: Day tradingu lub shortowania. Nie został zaprojektowany do identyfikacji sygnałów sprzedaży ani szczytów rynku.


