
AlgoCorner Crosshair Edge
Indikator
Versi 1.0, Apr 2025
Windows, Mac
5.0
Ulasan: 1
Crosshair Edge: Alat Visualisasi Data cTrader Terbaik
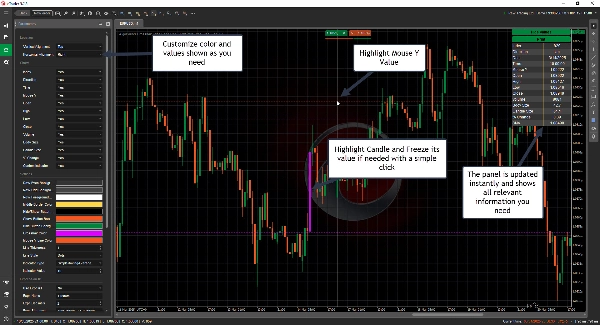
Dengan Crosshair Edge, sebuah alat kuat yang meningkatkan visualisasi data pasar di dalam platform cTrader, Anda dapat meningkatkan analisis grafik Anda ke tingkat yang lebih tinggi.
Interaksi Grafik yang Ditingkatkan
- Sorot bar saat ini dan rentangnya
- Bekukan crosshair pada lilin tertentu dengan sekali klik, dan buka kunci lagi dengan klik saat diperlukan
- Kirim nilai ke log Anda sehingga dapat dengan mudah disalin
- Tampilkan atau sembunyikan tata letak sesuai kebutuhan
Kustomisasi Penuh
- Personalisasi warna sesuai gaya Anda
- Sesuaikan crosshair ke lokasi mana pun yang Anda butuhkan di dalam grafik
- Pilih nilai mana yang ditampilkan dan nilai mana yang harus dihilangkan
Tampilan Data Lilin Instan
Cukup arahkan kursor ke lilin mana pun untuk memeriksa semua detailnya dan lainnya
- Indeks
- Arah
- Tanggal
- Waktu
- Harga Y Mouse
- Buka
- Tinggi
- Rendah
- Tutup
- Volume
- Ukuran Tubuh
- Ukuran Lilin
- % Perubahan
- Beberapa nilai indikator
-
- ADX
- ATR
- Chaikin Money Flow
- EMA, HMA, SMA, TSMA, TMA, WMA
- On Balance Volume
- RSI
- STD
- Weighted Close
- Welles Wilder Smoothing
- Williams %R
- Gambar Garis Horizontal/Vertikal dengan hotkey mudah
-
- Gambar Garis Horizontal: Ctrl + 1
- Gambar Garis Vertikal: Ctrl + 2
- Hotkey sepenuhnya dapat disesuaikan
- Formula yang Dapat Disesuaikan
-
- Gunakan Open, High, Low, Close, dan Index untuk menghitung formula yang sesuai dengan kebutuhan Anda
- Contoh, Harga Tipikal: (High[index] + Low[index] + Close[index])/3.0
Integrasi Tanpa Hambatan
- Lisensi terhubung ke ID cTrader Anda untuk kemudahan penggunaan
- Pembaruan masa depan termasuk
Tingkatkan pengalaman trading Anda dengan Crosshair Edge hari ini! 🚀
Profil indikator
5.0
Ulasan: 1
5 | 100 % | |
4 | 0 % | |
3 | 0 % | |
2 | 0 % | |
1 | 0 % |
Ulasan pelanggan
Indices
RSI
ATR
Produk-produk yang tersedia melalui cTrader Store, termasuk bot trading, indikator, dan plugin, disediakan oleh pengembang pihak ketiga serta hanya ditujukan untuk akses teknis dan informasi. cTrader Store bukan broker dan tidak menyediakan saran investasi, rekomendasi pribadi, atau jaminan apa pun tentang kinerja di masa mendatang.


10
Penjualan
336
Instal gratis