
STC
Wskaźnik
278 pobrania
Wersja 1.0, Jan 2025
Windows, Mac
5.0
Opinie: 2
Opis
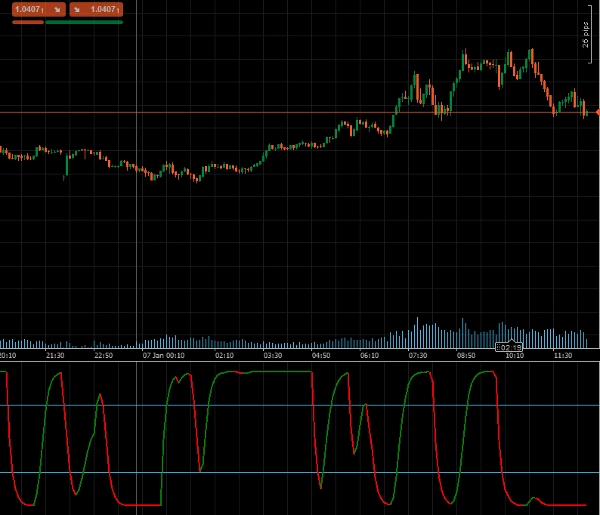
Schaff Trend Cycle (STC), opracowany przez znanego analityka technicznego Douga Schaffa, to zaawansowany wskaźnik handlowy zaprojektowany do identyfikacji trendów rynkowych i odwróceń z wyjątkową szybkością i precyzją. Opierając się na innowacyjnym pomyśle łączenia komponentów trendu i cyklu, STC wykorzystuje wykładnicze średnie kroczące (EMA) oraz obliczenia stochastyczne, aby przezwyciężyć ograniczenia wskaźników opóźnionych, takich jak MACD czy Oscylator Stochastyczny. To unikalne podejście zapewnia wcześniejsze, bardziej wiarygodne sygnały handlowe, oferując znaczącą przewagę w wykrywaniu trendów i analizie rynku.
Kluczowe cechy:
- Wczesne wykrywanie trendu: Łączy wykładnicze średnie kroczące (EMA) z obliczeniami stochastycznymi, aby szybciej wychwytywać trendy.
- Konfigurowalne ustawienia: Dostosuj długość, szybkie MA, wolne MA, typ MA oraz współczynnik wygładzania do swojej strategii handlowej.
- Wizualne alerty: Dynamiczne zmiany kolorów wskazują na trendy wzrostowe lub spadkowe, co ułatwia interpretację warunków rynkowych.
- Wsparcie dla poziomów wykupienia/wyprzedania: Wbudowane poziomy (25 i 75) pomagają zidentyfikować potencjalne punkty zwrotne rynku.
Parametry
- Długość: Określa liczbę okresów do obliczania trendu.
- Długość szybkiego MA: Ustawia długość szybkiej średniej kroczącej.
- Długość wolnego MA: Określa długość wolnej średniej kroczącej.
- Typ MA: Pozwala wybrać typ średniej kroczącej (np. EMA, SMA).
- Współczynnik wygładzania: Dostosowuje współczynnik wygładzania dla bardziej precyzyjnych sygnałów trendu.
Wyniki
- STC: Wyprowadza podstawową wartość Schaff Trend Cycle, reprezentującą kierunek i siłę trendu, do programowego wykorzystania w zautomatyzowanych systemach handlowych.
- STCBull: Podkreśla warunki trendu wzrostowego.
- STCBear: Podkreśla warunki trendu spadkowego.
Podsumowanie
Profil wskaźnika
Opinie klientów
5.0
Opinie: 2
5 | 100 % | |
4 | 0 % | |
3 | 0 % | |
2 | 0 % | |
1 | 0 % |
Opinie klientów
August 12, 2025
Pros: Fast and accurate trend detection, earlier signals than MACD, customizable levels. Cons: No alerts, no MTF mode, no trade statistics.
Dyskusja
Częste pytania
MACD
Produkty dostępne za pośrednictwem cTrader Store, w tym boty handlowe, wskaźniki i wtyczki, dostarczane są przez deweloperów zewnętrznych i udostępniane wyłącznie w celach informacyjnych oraz w celu zapewnienia dostępu technicznego. cTrader Store nie jest brokerem i nie zapewnia doradztwa inwestycyjnego, nie udziela spersonalizowanych rekomendacji ani nie gwarantuje przyszłych wyników.
Więcej od tego autora


Cena
Od 24/09/2024
4.46K
Bezpłatne instalacje