
Opis
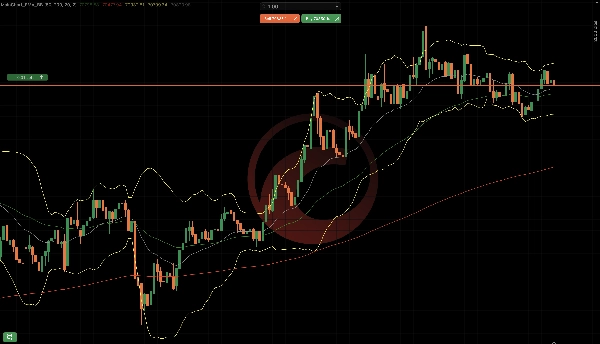
MainChart_EMA_BB jest wskaźnikiem nakładkowym na główny wykres dla cTrader, który łączy:
- Wykładnicze średnie kroczące (EMA 50 i EMA 200)
- Wstęgi Bollingera (górna / środkowa / dolna)
Składniki wskaźnika
Wykładnicze średnie kroczące (EMA)
Dostępne są dwie EMA:
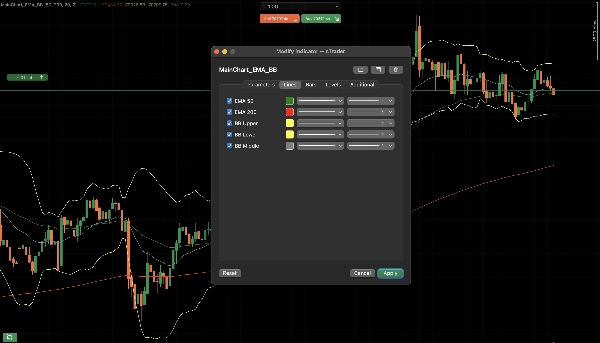
EMA Domyślny okres Domyślny kolor
EMA 50
50
Zielony
EMA 200
200
Czerwony
Cel:
- Kierunek trendu
- Dynamiczne wsparcie/opór
- EMA 50 powyżej EMA 200 → nastawienie bycze
- EMA 50 poniżej EMA 200 → nastawienie niedźwiedzie
Wstęgi Bollingera
Wstęgi Bollingera składają się z:
- Górna wstęga
- Środkowa wstęga (oparta na EMA)
- Dolna wstęga
Domyślne ustawienia:
- Okres: 20
- Odchylenie standardowe: 2.0
- Typ MA: wykładnicza
Cel:
- Pomiar zmienności
- Strefy wykupienia / wyprzedania
- Cena dotyka górnej wstęgi → potencjalne wyczerpanie
- Cena dotyka dolnej wstęgi → potencjalny odbicie
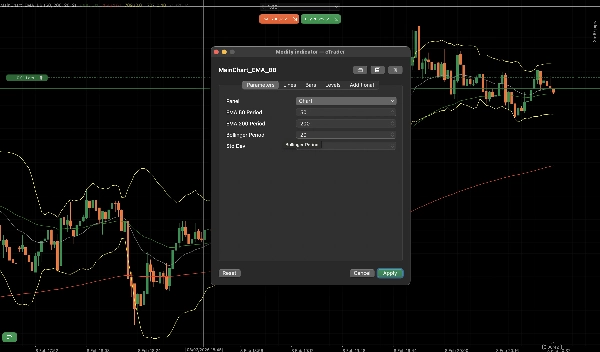
Wyjaśnienie parametrów
Parametry EMA
- Pokaż EMA 50: Włącz/wyłącz EMA 50
- Okres EMA 50: Okres obliczeniowy
- Pokaż EMA 200: Włącz/wyłącz EMA 200
- Okres EMA 200: Okres obliczeniowy
Parametry Wstęg Bollingera
- Pokaż Wstęgi Bollingera: Włącz/wyłącz BB
- Okres BB: Okres cofania
- Odchylenie standardowe BB: Mnożnik zmienności
Typowe zastosowanie w handlu
Potwierdzenie trendu
- EMA 50 powyżej EMA 200
- Preferuj tylko długie pozycje
Odwrócenie / korekta
- Cena cofa się do EMA 50
- Ściśnięcie Wstęg Bollingera, a następnie rozszerzenie
Dobrą cechą tego wskaźnika jest to, że jest konfigurowalny i nie ma potrzeby ustawiania wielu wskaźników.
Podsumowanie
Profil wskaźnika
Opinie klientów
4.5
Opinie: 2
5 | 50 % | |
4 | 50 % | |
3 | 0 % | |
2 | 0 % | |
1 | 0 % |
Opinie klientów
February 16, 2026
a 1R exit plan makes review easier, and messy areas become easier to avoid.
February 15, 2026
Dyskusja
Częste pytania
Prop
Forex
Indices
Commodities
Crypto
Stocks
Bollinger
Produkty dostępne za pośrednictwem cTrader Store, w tym boty handlowe, wskaźniki i wtyczki, dostarczane są przez deweloperów zewnętrznych i udostępniane wyłącznie w celach informacyjnych oraz w celu zapewnienia dostępu technicznego. cTrader Store nie jest brokerem i nie zapewnia doradztwa inwestycyjnego, nie udziela spersonalizowanych rekomendacji ani nie gwarantuje przyszłych wyników.
Więcej od tego autora


Cena
Od 01/04/2025