KST Momentum Heatwave — Transformez le momentum en température du marché (sur le graphique)
✅ Moteur KST moderne avec des paramètres optimisés (10/15/20/30 + 10/10/10/15, Signal 9)
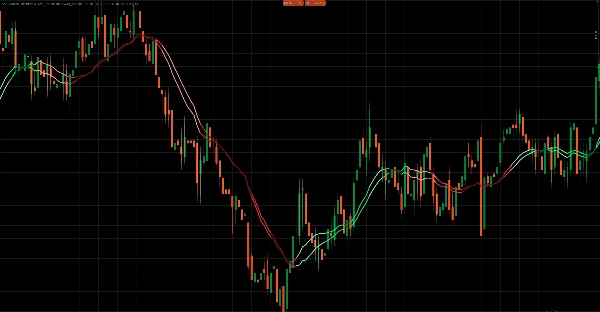
✅ Superposition de prix réelle — KST + Signal sont projetés directement sur le graphique autour d'une EMA de base
✅ 4 modes visuels : Pro Smooth / Classique / Raw Heat / Two Tier
✅ Carte thermique du momentum + lueur pour visualiser instantanément la force
✅ Force du momentum normalisée pour une cohérence entre les symboles et les périodes
✅ Système d'hystérésis anti-chop pour filtrer le bruit dans les marchés latéraux
Ce n'est pas un oscillateur traditionnel.
KST Momentum Heatwave transforme l'indicateur classique Know Sure Thing (KST) en un système visuel de température du momentum intégré directement à votre graphique.
Au lieu de regarder un oscillateur sous le graphique, le momentum devient une couche dynamique sur le prix — montrant la direction, la force et le cycle de vie du momentum d'une manière immédiatement interprétable.
Ce que fait l'indicateur et à quoi il est destiné
KST Momentum Heatwave convertit les données de momentum en une carte visuelle de la pression du marché.
Les oscillateurs traditionnels obligent les traders à alterner constamment leur attention entre le graphique des prix et une fenêtre d'indicateur séparée.
Cet indicateur élimine cette friction en projetant le momentum directement sur le graphique des prix lui-même.
Le résultat est un flux de travail plus clair où vous pouvez immédiatement voir :
- quand le momentum est en accélération
- quand une tendance est forte et dominante
- quand le momentum est en refroidissement
- quand le marché entre dans une phase de faible énergie et de chop
Il est conçu pour les traders qui veulent identifier rapidement :
- la force de la tendance
- les opportunités de continuation du momentum
- l'épuisement du momentum
- les changements de régime
Au lieu de deviner si un mouvement a de la puissance derrière lui, KST Momentum Heatwave rend cette pression visible.
Ce qu'il trace sur le graphique et comment le lire
L'indicateur trace deux lignes de momentum directement sur le graphique des prix, ainsi qu'une couche thermique visuelle.
1. Ligne KST — Noyau du momentum
La ligne principale de momentum calculée à partir de quatre composantes ROC pondérées.
Interprétation :
- KST au-dessus du Signal → momentum haussier
- KST en dessous du Signal → momentum baissier
La distance entre les deux lignes indique l'intensité du momentum.
2. Ligne Signal — Déclencheur du momentum
Une moyenne mobile lissée de la ligne KST.
Elle agit comme la ligne de déclenchement du momentum.
- Les croisements entre KST et Signal indiquent souvent des changements ou accélérations du momentum.
3. Couche thermique du momentum
L'indicateur convertit la distance entre KST et Signal en une valeur de force normalisée entre 0 et 1.
Cette valeur détermine l'intensité des couleurs et la visualisation de la carte thermique.
Interprétation :
- Couleurs vives/claires → momentum fort
- Couleurs normales → pression de tendance stable
- Couleurs foncées → momentum en affaiblissement
- Couleurs qui s'estompent → ralentissement ou transition potentielle
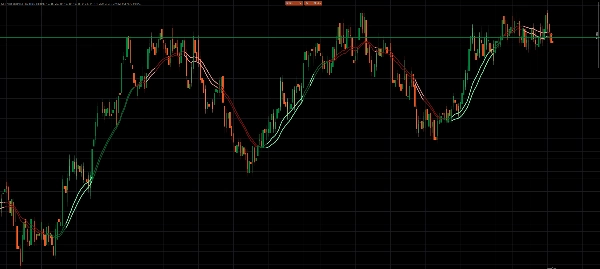
Les effets optionnels de carte thermique et de lueur colorent les chandeliers eux-mêmes, permettant aux traders de voir instantanément quand le marché « chauffe ».
4. Couche de projection des prix
Au lieu de tracer des valeurs brutes d'oscillateur, l'indicateur projette le momentum sur le prix en utilisant :
- une EMA de base
- une amplitude mise à l'échelle par ATR
Cela maintient la superposition proportionnelle au graphique et garantit que l'indicateur reste lisible sur différents marchés et périodes.
Modes visuels et comportement
KST Momentum Heatwave comprend quatre styles visuels qui modifient la façon dont le momentum est interprété.
Pro Smooth
Le mode le plus avancé.
Caractéristiques :
- coloration du momentum basée sur le cycle de vie
- filtrage par hystérésis
- exigences de confirmation avant les inversions de direction
Cela réduit considérablement le bruit pendant les marchés latéraux ou agités.
Classique
Utilise la coloration du cycle de vie sans filtrage par hystérésis.
Résultat :
- réponses plus rapides du momentum
- légèrement plus sensible aux fluctuations du marché
Idéal pour le trading intraday et swing.
Raw Heat
Se concentre uniquement sur la force absolue du momentum.
Le momentum est catégorisé en trois niveaux :
- fort
- moyen
- faible
Ce mode est idéal pour les traders qui veulent une lecture pure de la puissance du momentum.
Two Tier
Un mode d'interprétation simplifié.
- KST au-dessus/en dessous du Signal définit la direction
- un seuil de force définit momentum fort vs faible
Conçu pour les traders qui préfèrent une complexité visuelle minimale.
Comment utiliser KST Momentum Heatwave
Étape 1 — Sélectionnez votre mode visuel
Utilisez le mode qui correspond à votre style de trading :
- Pro Smooth → signaux les plus clairs dans les marchés bruyants
- Classique → réactions plus rapides
- Raw Heat → focus sur la force du momentum
- Two Tier → interprétation simple fort vs faible
Étape 2 — Identifiez le régime de momentum
Recherchez le comportement dominant des couleurs :
- Couleurs haussières dominantes → biais long
- Couleurs baissières dominantes → biais court
- Couleurs foncées qui s'estompent → affaiblissement du momentum
- Inversions fréquentes des couleurs → conditions probablement en range
Étape 3 — Utilisez le momentum pour le timing des trades
Les cas d'utilisation typiques incluent :
Continuation de tendance
Entrez lors des replis lorsque le régime de momentum reste intact et que la force reste élevée.
Épuisement du momentum
Réduisez l'exposition lorsque les couleurs s'assombrissent et que la force diminue.
Renversement du momentum
Surveillez les inversions KST/Signal combinées à une force croissante.
Exemple de configuration recommandée
Une configuration équilibrée pour la plupart des marchés :
Préréglage : Swing_Classic
Mode visuel : Pro Smooth
EMA de base : 34
Période ATR : 14
Amplitude ATR : 1.40
Fenêtre de normalisation : 200
Carte thermique : Activée
Lueur : Activée
Marchés et périodes recommandés
Parce que l'indicateur utilise la mise à l'échelle ATR et la force normalisée, il s'adapte bien à la plupart des marchés.
Fonctionne particulièrement bien sur :
Forex
- M5 – H1 pour le trading intraday
- H1 – H4 pour le swing trading
Indices
- M1 – M15 pour le scalping de momentum
- M15 – H1 pour le trading de tendance structuré
Crypto
- M5 – H1 (Pro Smooth recommandé)
- H1 – H4 pour les environnements de tendance
Commodités
- M15 – H4
Les périodes plus courtes bénéficient le plus du filtrage Pro Smooth.
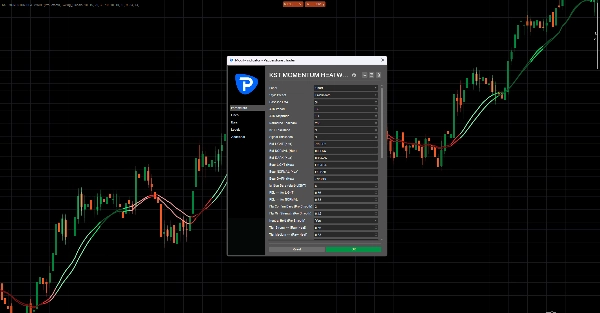
Paramètres clés et ce qu'ils contrôlent
Système de préréglage
Les préréglages Scalp_Clean, Swing_Classic, Smooth et Aggressive ajustent la configuration interne du KST.
Le mode personnalisé permet un contrôle manuel complet.
Normalisation du momentum
Fenêtre de normalisation
Contrôle la fenêtre historique utilisée pour mettre à l'échelle la force du momentum.
Des valeurs plus élevées produisent des lectures plus lisses.
Projection de superposition
EMA de base
Définit la ligne d'ancrage utilisée pour projeter la superposition du momentum.
Amplitude ATR
Contrôle jusqu'où la superposition s'étend à partir de la ligne de base.
Contrôles anti-chop (Pro Smooth)
Barres de confirmation d'inversion
Nombre de barres nécessaires pour confirmer un changement de régime.
Force minimale d'inversion
Force minimale du momentum requise avant d'accepter une inversion.
Maintien neutre
Aide à stabiliser le régime pendant les conditions de momentum faible.
Visualisation de la chaleur et de la lueur
Contrôle la réactivité de la carte thermique à la force du momentum.
Les paramètres incluent :
- Largeur de la chaleur
- Alpha de la chaleur
- Gamma de la chaleur
- Force de la lueur
Gestion des performances
Conserver les barres
Limite le nombre d'objets visuels restant sur le graphique pour maintenir un fonctionnement fluide de l'indicateur.
Notes importantes
Intensité des objets du graphique
Les effets de carte thermique et de lueur dessinent plusieurs objets.
Si les performances ralentissent :
- réduisez Conserver les barres
- réduisez la largeur de la chaleur
- désactivez la lueur
Saturation de la force
Des pics extrêmes de volatilité peuvent rapidement pousser la force proche de son maximum.
Si cela se produit :
- augmentez la fenêtre de normalisation
- passez en mode Pro Smooth
À utiliser de préférence avec une structure
KST Momentum Heatwave est conçu comme une couche de régime de momentum, pas comme un générateur d'entrées autonome.
Pour de meilleurs résultats, combinez-le avec :
- support et résistance
- structure du marché
- zones de liquidité
- analyse de tendance


