Opis
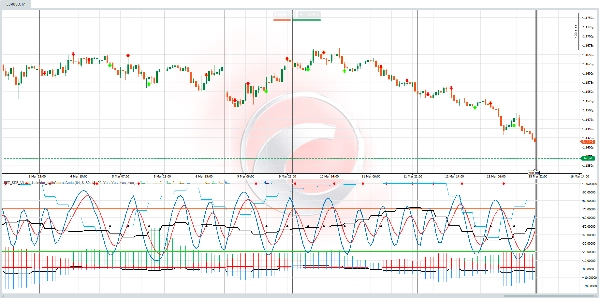
Większość traderów polega na wskaźnikach opóźnionych, które reagują na cenę dopiero po zaistnieniu ruchu. FFT-SDE Visual Engine przyjmuje zasadniczo inne, ilościowe podejście. To nie jest zwykły oscylator; to zestaw narzędzi do przetwarzania sygnałów i prognozowania w czasie rzeczywistym, wbudowany bezpośrednio w cTrader.
Działa na dwóch podstawowych zasadach:
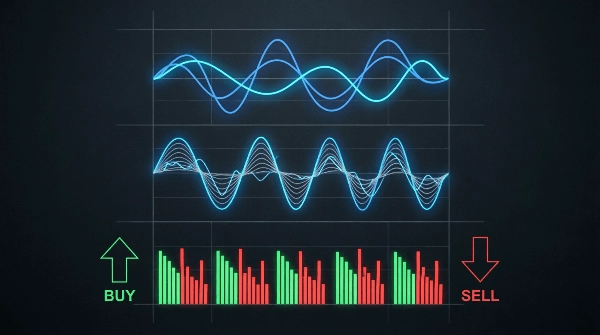
- Rynek ma rytmy (cykle): Wykorzystując analizę szybkiej transformaty Fouriera (FFT), wskaźnik rozkłada ruch cenowy na podstawowe składowe częstotliwościowe, filtrując szumy, aby ujawnić dominujący, możliwy do handlu cykl. Informuje to, kiedy rynek prawdopodobnie się odwróci.
- Ruch cen ma charakter statystyczny (SDE): Modelując cenę jako stochastyczne równanie różniczkowe (proces Ornsteina-Uhlenbecka), kwantyfikuje dryf rynku (momentum), zmienność (ryzyko) oraz szybkość powrotu do średniej. Informuje to, jak rynek prawdopodobnie się poruszy oraz prawdopodobieństwo udanej transakcji.
Łącząc te dwa światy—Analizę cykli (FFT) i Prognozowanie stochastyczne (SDE)—silnik FFT-SDE zapewnia całościowy obraz rynku, niedostępny w standardowych narzędziach.
2. Główna użyteczność: Jakie problemy rozwiązuje?
Oto jak trader może wykorzystać ten wskaźnik, aby poprawić swoje decyzje:
- Problem 1: „Nie potrafię rozpoznać, czy rynek jest trendujący, czy tylko konsoliduje się.”
-
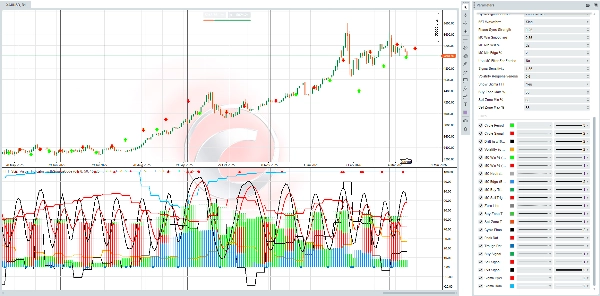
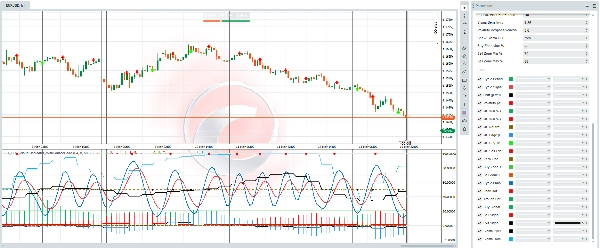
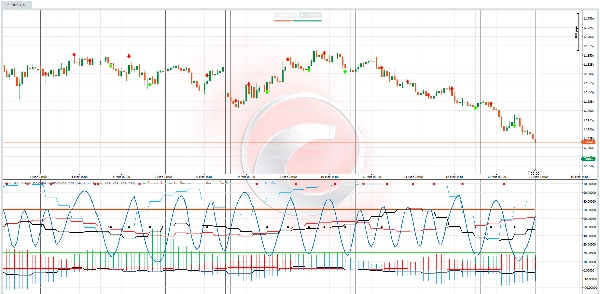
- Rozwiązanie (Okres cyklu i sigma cykliczności): Histogram okresu cyklu natychmiast pokazuje długość dominującego obecnie cyklu rynkowego. Gdy cykl jest wyraźny i silny, możesz handlować wahaniami. Gdy Sigma cykliczności % (cykl zmienności) jest wysoka, wiesz, że należy spodziewać się okresów rozszerzenia i kurczenia ryzyka, co pozwala dynamicznie dostosowywać wielkość pozycji.
- Problem 2: „Moje wejścia są zawsze za wcześnie lub za późno.”
-
- Rozwiązanie (Faza cyklu i strefy wejścia): Wskaźnik odwzorowuje cykl rynku na płynną falę 0-100% — Faza cyklu % . Zamiast zgadywać szczyty i dołki, możesz czekać, aż cena wejdzie w zdefiniowane wcześniej strefy kupna (0-35%) i sprzedaży (60-88%). To nie są arbitralne poziomy; są dynamicznie wyprowadzone z dominującej częstotliwości rynku, dając znaczącą przewagę czasową.
- Problem 3: „Nie wiem, czy setup ma wysokie prawdopodobieństwo sukcesu.”
-
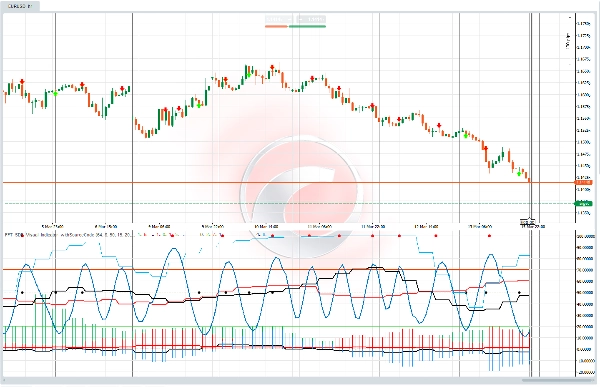
- Rozwiązanie (symulacja Monte Carlo): To jest kluczowa funkcja. Dla każdej świecy silnik uruchamia setki symulowanych ścieżek cenowych (Monte Carlo) opartych na aktualnej dynamice rynku. Następnie wyświetla MC Win % (Kupno) i MC Win % (Sprzedaż) . To nie jest przeczucie ani intuicja; to statystyczne prawdopodobieństwo powodzenia transakcji o stosunku ryzyka do zysku 1:2,5 zanim w ogóle ją otworzysz. Dosłownie widzisz, czy szanse są po twojej stronie.
- Problem 4: „Standardowe wskaźniki są zbyt wolne i zaszumione.”
-
- Rozwiązanie (adaptacyjny i wieloaspektowy): Ten wskaźnik nie jest statyczny. Jego adaptacyjny model zmienności reaguje w czasie rzeczywistym na szoki cenowe i impulsy cyklu. Sigma FFT informuje, czy sama zmienność staje się cykliczna, ostrzegając o nadchodzących cichych lub wybuchowych okresach. Każdy element jest zaprojektowany tak, aby dostosowywać się do aktualnych warunków rynkowych.
Nie znajdziesz innego wskaźnika na rynku cTrader, który łączyłby te funkcje w jeden spójny i wizualny system.
- Warstwa „Sigma FFT”: To jedno wiedzieć, że cena ma cykl. To zupełnie inny poziom zaawansowania wiedzieć, że sama zmienność ma cykl. To daje ogromną przewagę w przewidywaniu zmian struktury rynku.
- Prawdopodobieństwo, nie pewność: Wyniki Monte Carlo odciągają tradera od poszukiwania „świętego graala” pewności i kierują ku profesjonalnemu podejściu zarządzania prawdopodobieństwami i przewagami.
- W pełni wizualny i konfigurowalny: Cała ta złożona matematyka jest przedstawiona w czystym, wielopanelowym formacie z szerokimi możliwościami dostosowania (ponad 27 parametrów). Możesz go dopasować do swojego stylu handlu, od skalpowania po trading swingowy.
- Spójne połączenie: Faza cyklu generująca sygnały kupna/sprzedaży jest tą samą fazą używaną do obliczania dryfu i adaptacyjnej zmienności. Każda część wskaźnika współgra z pozostałymi, tworząc jednolity i spójny model rynku.
Ten wskaźnik jest idealny dla tradera, który:
- Ma dość wskaźników opóźnionych i chce bardziej predykcyjne, naukowe podejście.
- Ma pewną wiedzę o cyklach, zmienności i wartości prawdopodobieństwa statystycznego.
- Chce zbudować solidny, oparty na regułach system handlowy.
- Handluje instrumentami o zachowaniu cyklicznym (np. pary Forex, indeksy, surowce takie jak złoto).
- Jest gotów zainwestować w profesjonalne narzędzie, aby uzyskać prawdziwą przewagę na rynku.
FFT-SDE Visual Engine przekształca złożone koncepcje finansów ilościowych w praktyczne, wykonalne narzędzie handlowe. Przenosi Cię od zgadywania do wiedzy, od reakcji do przewidywania. Jeśli jesteś gotów handlować z głębszym zrozumieniem struktury rynku i mierzalną, probabilistyczną przewagą, to jest silnik, na który czekałeś.
Podsumowanie
Opinie klientów
5 | 67 % | |
4 | 33 % | |
3 | 0 % | |
2 | 0 % | |
1 | 0 % |