
Dominator M4tr1x
To jest podstawowe narzędzie informacyjne, które łączy analizę struktury cenowej smart-money na wykresie z wieloma panelami informacyjnymi. Oto przegląd każdego głównego systemu:
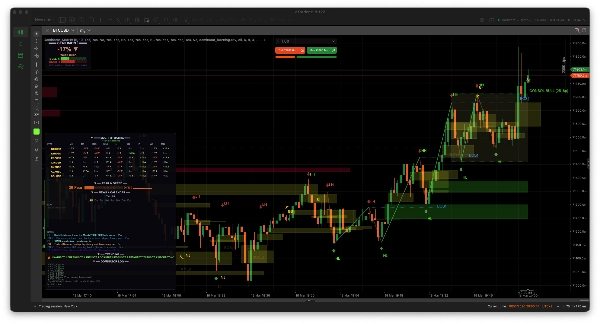
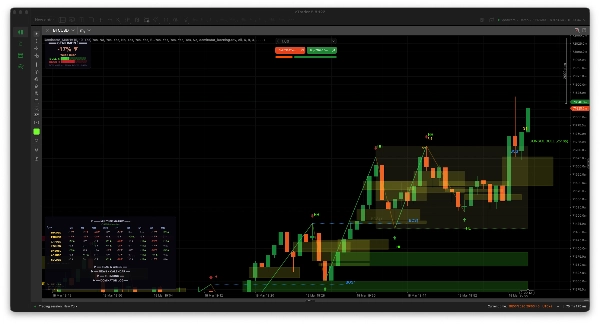
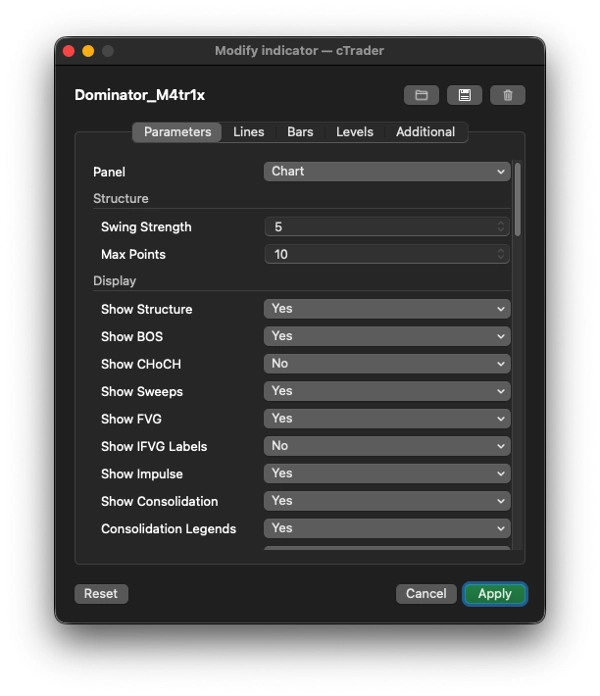
1. 📊 NA WYKRESIE: Analiza Struktury Smart Money
Rysuje bezpośrednio na wykresie cenowym:
Funkcja
Co robi ;
Wykrywanie huśtawek
Identyfikuje lokalne maksima/minima huśtawek za pomocą konfigurowalnej siły cofnięcia, oznacza je strzałkami (▲/▼)
Etykiety struktury
Oznacza każdą huśtawkę jako HH (Higher High), HL (Higher Low), LH (Lower High), LL (Lower Low) aby odwzorować strukturę rynku
BOS (Przełamanie Struktury)
Rysuje przerywane linie + etykiety, gdy cena przebija poprzednie maksimum/minimum huśtawki w kierunku trendu
CHoCH (Zmiana Charakteru)
Tak samo jak BOS, ale przeciwko trendowi — sygnalizuje potencjalne odwrócenie trendu
Unieważnienie przełamania
Jeśli cena cofa się przez poziom BOS/CHoCH, oznacza to jako nieudane (wyszarzone z ✗) i rejestruje to
Zamiatanie płynności
Wykrywa, gdy cena przebija ponad maksimum huśtawki (lub poniżej minimum), ale zamyka się z powrotem w środku — klasyczny wzór na zdobywanie płynności
FVG (Luki Wartości Rynkowej)
Wykrywa nierównowagi 3 świecowe (luki między maksimum świecy 1 a minimum świecy 3). Rysuje kolorowe prostokąty na wykresie
IFVG (Odwrócone FVG)
Gdy cena wraca, aby wypełnić FVG, oznacza to jako "IFVG" (luka staje się potencjalną strefą wsparcia/oporu)
Unieważnienie FVG
Jeśli cena zamyka się zdecydowanie przez strefę FVG, jest oznaczona jako unieważniona
Fale impulsowe
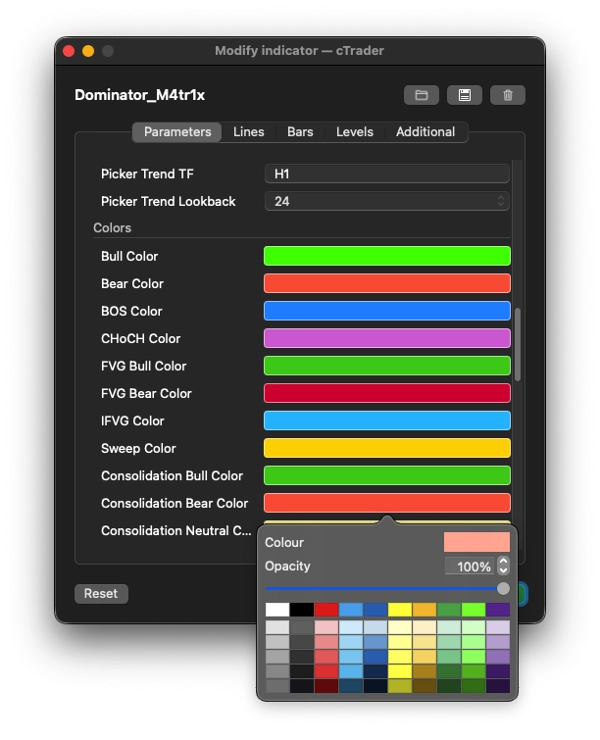
Łączy punkty huśtawek liniami trendu — zielone dla nóg impulsowych (zgodnych z trendem), żółte dla nóg korekcyjnych
Strefy konsolidacji
Wykrywa, gdy kolejne maksima i minima huśtawek mieszczą się w wąskim zakresie opartym na ATR, rysuje ramkę z etykietą "CONSOL BULL/BEAR/NEUTRAL" pokazującą kierunek i szerokość pipsów
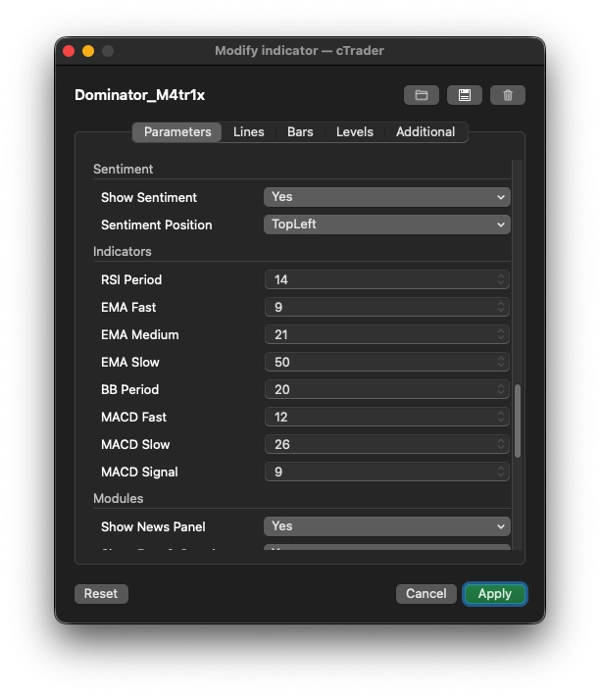
2. 📈 PANEL SENTYMENTU (domyślnie w lewym górnym rogu)
Rzeczywisty wskaźnik punktacji byków/niedźwiedzi dla aktualnego symbolu/ramy czasowej wykresu, wykorzystujący:
- RSI (wykrywanie wyprzedania/wykupienia + dywergencji)
- MACD (przecięcia, momentum histogramu)
- 3 EMA (szybkie/średnie/wolne wyrównanie i pozycja ceny względem nich)
- Wstęgi Bollingera (cena na ekstremach górnej/dolnej wstęgi)
Wyświetla:
- wynik procentowy od -100% do +100% (np. "+67% SILNY BYK")
- Wizualne słupki punktów byków vs. niedźwiedzi (█████░░░░)
- Bieżące statystyki sygnałów (łączna liczba sygnałów, potwierdzone, unieważnione, % trafności)
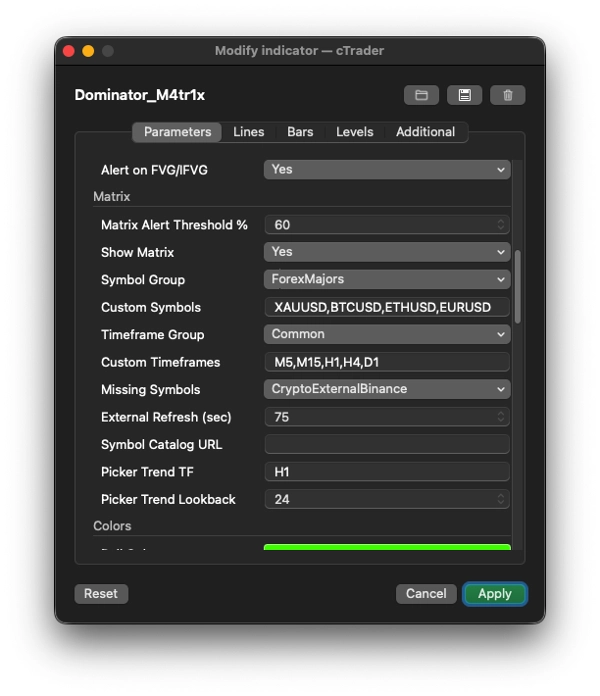
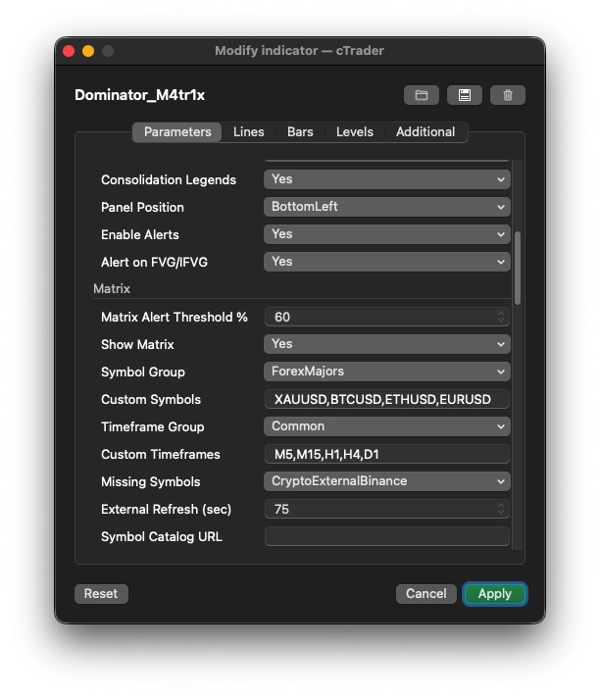
3. 🔢 MACIERZ WIELOKROTNYCH RAM CZASOWYCH (główny panel)
Siatka/heatmapa pokazująca wyniki sentymentu byków/niedźwiedzi dla wielu symboli × wielu ram czasowych jednocześnie.
Aspekt
Szczegóły
Grupy symboli
Forex Majors/Minors/Exotics, Crypto, Indeksy, Akcje USA, Metale, Energia, Surowce lub Własne
Grupy ram czasowych
Popularne (M5–W1), Wszystkie lub Własne
Każda komórka
Pokazuje kolorowany wynik jak "+42▲" (zielony) lub "-67▼" (czerwony) używając tego samego silnika punktacji RSI/MACD/EMA/BB
Rozpoznawanie symboli
Bardzo solidne — automatycznie wykrywa konwencje nazewnictwa brokera (sufiksy takie jak .r, m, .cash, ukośniki jak EUR/USD), próbuje dziesiątki wariantów aliasów, buforuje wyniki
Dane zewnętrzne
Dla symboli, których broker nie oferuje (szczególnie kryptowaluty), pobiera dane OHLC z Binance, Bybit, OKX, Kraken, Bitfinex API (darmowe, bez klucza)
Premium API
Opcjonalnie obsługuje TwelveData, AlphaVantage, Polygon, Stooq dla akcji/indeksów/forex za pomocą kluczy API
Interaktywny
Kliknij nazwę symbolu → otwiera wyszukiwarkę symboli z ponad 100 symbolami ze wszystkich kategorii, pokazując 24h % zmiany. Kliknij nagłówek ramy czasowej → otwiera wybór ram czasowych do zmiany kolumn
Alerty
Gdy dowolna komórka przekracza konfigurowalny próg (np. ±60%), odtwarza dźwięk alertu
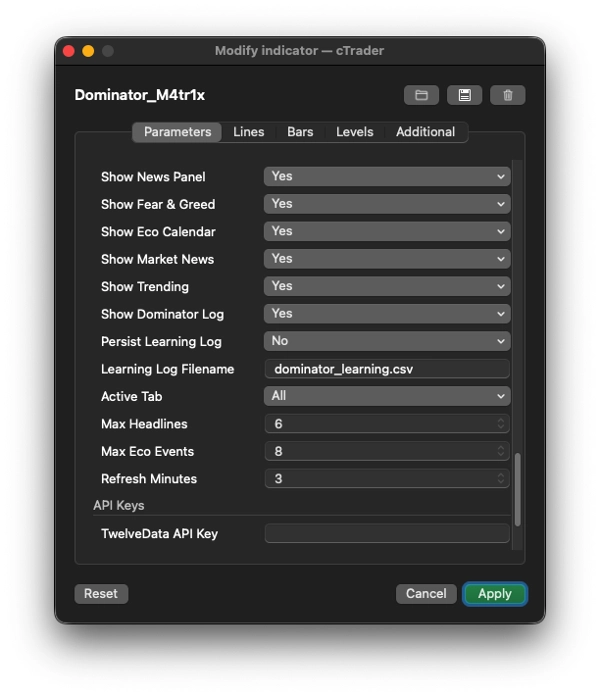
4. 📰 PANELE WIADOMOŚCI I INFORMACJI
Kalendarz ekonomiczny
Agreguje nadchodzące wydarzenia ekonomiczne o wysokim/średnim wpływie z ponad 8 redundantnych źródeł:
- ForexFactory (JSON + XML), TradingView, Finnhub, TradingEconomics, MQL5, FXStreet, FMP (FinancialModelingPrep)
- Kolorowane według pilności (czerwony = TERAZ, pomarańczowy = <15 min, żółty = <1 godzina, zielony = później)
Nagłówki wiadomości rynkowych
Agreguje z ponad 12 źródeł RSS/API:
- Krypto: CryptoCompare, CoinDesk, CoinTelegraph, NewsBTC, ogłoszenia Binance, status systemu OKX
- Forex: FXStreet, ForexLive
- Indeksy/Akcje: MarketWatch, CNBC, Reuters, Yahoo Finance
- Automatycznie kategoryzuje nagłówki (krypto/forex/metale/energia/akcje) przez wykrywanie słów kluczowych
- Filtrowalne według zakładki (Wszystkie, Forex, Krypto, Metale, Indeksy, Akcje, Energia, Ekonomiczne)
Indeks Strachu i Chciwości
- Pobiera Crypto Fear & Greed Index (API alternative.me, z zapasowym CNN Business)
- Pokazuje wartość liczbową (0–100), etykietę (Ekstremalny Strach → Ekstremalna Chciwość), pasek kolorów oraz 7-dniową historię sparkline (▁▂▃▄▅▆▇█)
Trending
- Pobiera najlepiej radzące sobie kryptowaluty z 24-godzinnego tickera Binance (top 5 wzrostów + top 5 spadków)
- W razie potrzeby korzysta z CoinGecko trending lub CoinPaprika
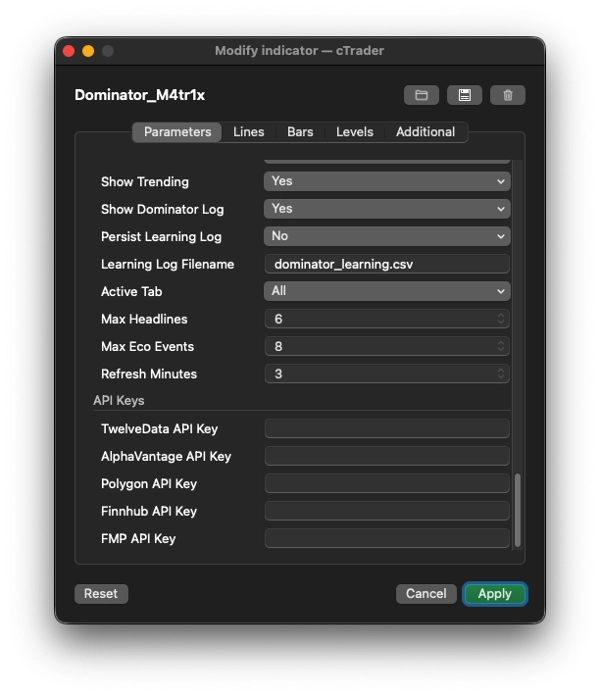
5. 📝 DZIENNIK DOMINATORA + SYSTEM NAUKI
- Prowadzi bieżący dziennik sygnałów pokazujący ostatnie 8 sygnałów ze statusem (● aktywny, ✓ potwierdzony, ✗ unieważniony)
- Śledzi ogólne statystyki trafności (łączna liczba sygnałów, potwierdzone realizacje, unieważnienia, % trafności)
- Opcjonalna trwałość CSV: zapisuje każde zdarzenie sygnału (nowy/potwierdzenie/unieważnienie) do pliku CSV (
dominator_learning.csv) z pełnymi metadanymi — zaprojektowane do wykorzystania w przyszłym uczeniu maszynowym lub testach historycznych
6. 🛠 Najważniejsze cechy architektury technicznej
- Pełne nakładanie (
IsOverlay = true) — rysuje na wykresie cenowym, nie na osobnym panelu - AccessRights = None — działa w piaskownicy brokera (bez dostępu do systemu plików / sieci poza tym, co pozwala cAlgo)
- Asynchroniczne pobieranie danych — wszystkie wywołania HTTP działają w tle na wątkach za pomocą
Task.Run(), aby nigdy nie blokować wykresu - Inteligentne buforowanie — rozpoznawanie symboli, zewnętrzne dane OHLC, ceny tickerów i procenty trendów są buforowane z konfigurowalnymi interwałami odświeżania
- Automatyczne ponawianie — nieudane rozpoznania symboli i pobierania danych zewnętrznych są ponawiane co 45 sekund
- Sekcje zwijane — każda sekcja panelu (Macierz, Strach i Chciwość, Wiadomości, Trending, Dziennik) może być zwinięta/rozwinięta przez kliknięcie nagłówka
Podsumowując
Dominator M4tr1x to wskaźnik informacyjny, który zastępuje cały pulpit handlowy. Odwzorowuje strukturę smart-money na wykresie (BOS, CHoCH, FVG, zamiatania, konsolidacje), ocenia sentyment multi-aktywny/multi-ramowy za pomocą wskaźników technicznych, agreguje kalendarze ekonomiczne i wiadomości rynkowe z ponad 20 źródeł, śledzi Strach i Chciwość, pokazuje trendy aktywów, rejestruje wszystkie własne sygnały z monitorowaniem trafności oraz pozwala interaktywnie zmieniać symbole i ramy czasowe — wszystko to podczas pobierania brakujących danych z ponad 5 zewnętrznych API giełd w tle.
5 | 0 % | |
4 | 100 % | |
3 | 0 % | |
2 | 0 % | |
1 | 0 % |


