
ChoppinessIndex
Wskaźnik
154 pobrania
Wersja 1.0, Mar 2026
Windows, Mac
Od 16/01/2025
3.15M
Wolumen transakcji
2.04K
Zysk w pipsach
399
Bezpłatne instalacje
Opis
Jak to działa
- Okres: domyślnie 14. Wskaźnik oblicza stosunek sumy zakresów high–low w danym okresie do rzeczywistego zakresu w tym samym okresie, a następnie skaluje wynik za pomocą wzoru logarytmicznego: choppiness = 100 * log10(sum(Range) / TrueRange) / log10(Period)
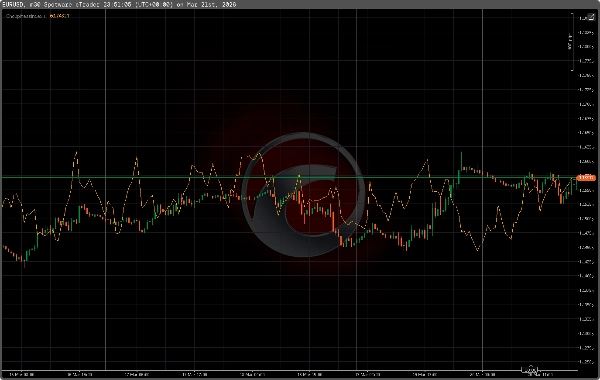
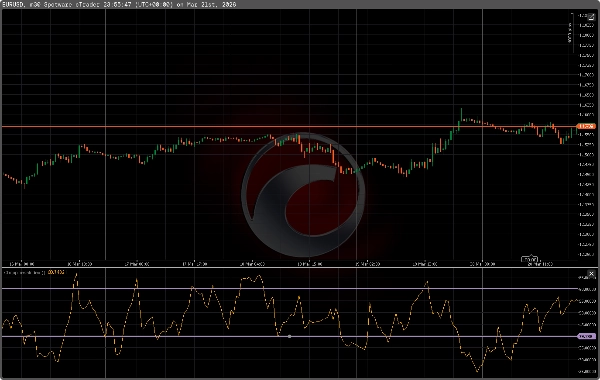
- Wynik: pojedyncza linia oznaczona jako "CMI" (domyślnie pomarańczowa), gdzie:
-
- Wysokie wartości = rynek jest niestabilny/zakresowy (unikaj transakcji kierunkowych lub czekaj na potwierdzenie wybicia)
- Niskie wartości = rynek jest trendujący (szukaj okazji podążania za trendem)
Interpretacja i typowe ustawienia
- Domyślny okres: 14 (dostosuj do 7–28 w zależności od ram czasowych i rynku).
- Typowe progi (zalecane, regulowane):
-
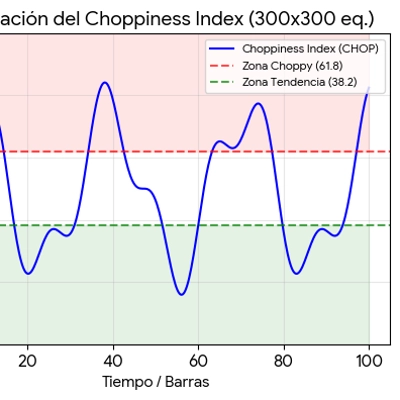
- Powyżej ~61,8 → bardzo niestabilny / zakresowy
- 38,2–61,8 → mieszany / konsolidacja
- Poniżej ~38,2 → rynek trendujący (silny ruch kierunkowy)
- Ram czasowych:
-
- Używaj wyższych ram czasowych (H1, H4, Daily) do potwierdzenia trendu i transakcji swingowych.
- Używaj niższych ram czasowych (M5–M30) z mniejszym Okresem do ustawień skalpowania.
- Rynki: działa na Forex, złoto/srebro (XAUUSD/XAGUSD), indeksy i kryptowaluty. Wydajność zależy od profilu zmienności instrumentu.
Jak używać w strategii
- Filtr wybicia: podejmuj pozycje wybicia tylko wtedy, gdy CMI jest poniżej twojego progu trendu (np. <38).
- Potwierdzenie trendu: łącz z wskaźnikiem trendu (średnie kroczące, Supertrend) i/lub wskaźnikami momentum (MACD, RSI) — wchodź w transakcje, gdy oba potwierdzają trend/momentum, a CMI wskazuje środowisko trendujące.
- Unikaj szumu sygnałowego: gdy CMI jest powyżej progu niestabilności (np. >61), odłóż transakcje kierunkowe lub zaostrz stop lossy.
- Parowanie zmienności: używaj ATR lub Bollinger Bands do określania ryzyka i potwierdzania reżimów zmienności.
Wskaźniki uzupełniające
- ADX (siła trendu), ATR (zmienność), MACD / RSI (momentum), Supertrend lub średnie kroczące (kierunek trendu), Bollinger Bands (zakres/zmienność).
Instalacja i parametry
- Parametr: Okres (domyślnie 14).
- Nazwa wyjścia: CMI (pomarańczowy).
- Brak przerysowań: wartości są obliczane na zakończonych słupkach; stosuj standardowe zarządzanie ryzykiem i potwierdzenia.
Ostrzeżenie o ryzyku Ten wskaźnik dostarcza sygnały informacyjne wspierające podejmowanie decyzji. Nie jest samodzielnym systemem handlowym. Przetestuj i zweryfikuj ustawienia dla swoich instrumentów i ram czasowych. Zawsze stosuj odpowiednie zarządzanie ryzykiem i kapitałem.
Podsumowanie
AI summary
The Choppiness Index (CMI) is a technical indicator designed to distinguish trending markets from ranging (choppy) markets, aiding traders in filtering breakout signals and improving trend-following entries. It calculates the ratio of the sum of high–low price ranges over a specified period (default 14) to the true range, then applies a logarithmic scale to produce a single output line labeled "CMI."
Key functionality includes:
- High CMI values indicate a choppy or range-bound market, suggesting caution with directional trades or waiting for breakout confirmation.
- Low CMI values signal trending markets, highlighting opportunities for trend-following strategies.
- Adjustable period settings (7–28) allow tuning based on timeframe and market conditions.
- Suggested thresholds: above ~61.8 for choppy markets, 38.2–61.8 for consolidation, and below ~38.2 for trending conditions.
- Suitable for multiple markets including Forex, commodities (gold, silver), indices, cryptocurrencies, and stocks.
- Recommended use on higher timeframes (H1, H4, Daily) for trend confirmation and swing trading, and on lower timeframes (M5–M30) with shorter periods for scalping.
- Can be combined with other indicators such as ADX, ATR, MACD, RSI, Supertrend, and Bollinger Bands for enhanced strategy development.
- Non-repainting values are calculated on completed bars to support reliable analysis.
This indicator serves as an informational tool to support trading decisions and should be used alongside proper risk management and complementary indicators.
Key functionality includes:
- High CMI values indicate a choppy or range-bound market, suggesting caution with directional trades or waiting for breakout confirmation.
- Low CMI values signal trending markets, highlighting opportunities for trend-following strategies.
- Adjustable period settings (7–28) allow tuning based on timeframe and market conditions.
- Suggested thresholds: above ~61.8 for choppy markets, 38.2–61.8 for consolidation, and below ~38.2 for trending conditions.
- Suitable for multiple markets including Forex, commodities (gold, silver), indices, cryptocurrencies, and stocks.
- Recommended use on higher timeframes (H1, H4, Daily) for trend confirmation and swing trading, and on lower timeframes (M5–M30) with shorter periods for scalping.
- Can be combined with other indicators such as ADX, ATR, MACD, RSI, Supertrend, and Bollinger Bands for enhanced strategy development.
- Non-repainting values are calculated on completed bars to support reliable analysis.
This indicator serves as an informational tool to support trading decisions and should be used alongside proper risk management and complementary indicators.
Profil wskaźnika
Opinie klientów
0.0
Opinie: 0
Opinie klientów
Ten produkt nie ma jeszcze opinii. Wypróbowałeś(-aś) go już? Bądź pierwszy(-a) i powiedz o tym innym!
Dyskusja
Częste pytania
Forex
Signal
Breakout
Scalping
Indices
Commodities
Crypto
Stocks
Produkty dostępne za pośrednictwem cTrader Store, w tym boty handlowe, wskaźniki i wtyczki, dostarczane są przez deweloperów zewnętrznych i udostępniane wyłącznie w celach informacyjnych oraz w celu zapewnienia dostępu technicznego. cTrader Store nie jest brokerem i nie zapewnia doradztwa inwestycyjnego, nie udziela spersonalizowanych rekomendacji ani nie gwarantuje przyszłych wyników.
Więcej od tego autora
















Cena
Od 16/01/2025
3.15M
Wolumen transakcji
2.04K
Zysk w pipsach
399
Bezpłatne instalacje