present
Zarejestruj się i otrzymaj 50 $ zniżki na pierwszy zakup
Trading product for MtfCandleLite Wskaźnik Support & Resistance, image 1
MtfCandleLite
Wskaźnik
Wersja 1.0, May 2026
Windows, Mac
Trading product for MtfCandleLite Wskaźnik Support & Resistance, image 2
Trading product for MtfCandleLite Wskaźnik Support & Resistance, image 3
Trading product for MtfCandleLite Wskaźnik Support & Resistance, image 4
Trading product for MtfCandleLite Wskaźnik Support & Resistance, image 5
Od 09/05/2026

Opis

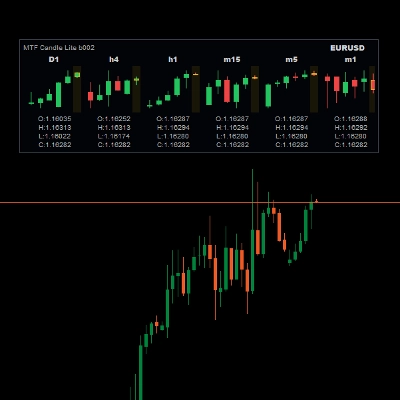
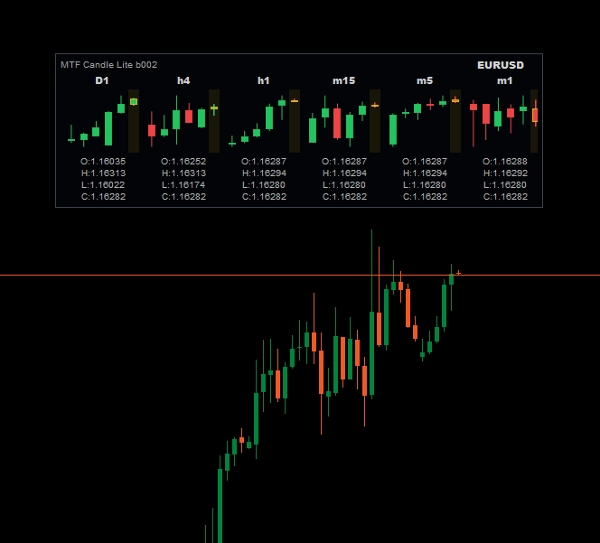
MTF Candle Lite is a lightweight multi-timeframe candle panel for cTrader. It displays mini candles from up

to six selected timeframes in a compact horizontal layout, helping traders check higher-timeframe and

lower-timeframe candle direction without opening multiple charts.


The indicator is designed for discretionary traders who want quick visual context before making their own

trading decisions. It does not open trades, does not generate automatic entry signals, and does not use

account or trading permissions.


Key features:


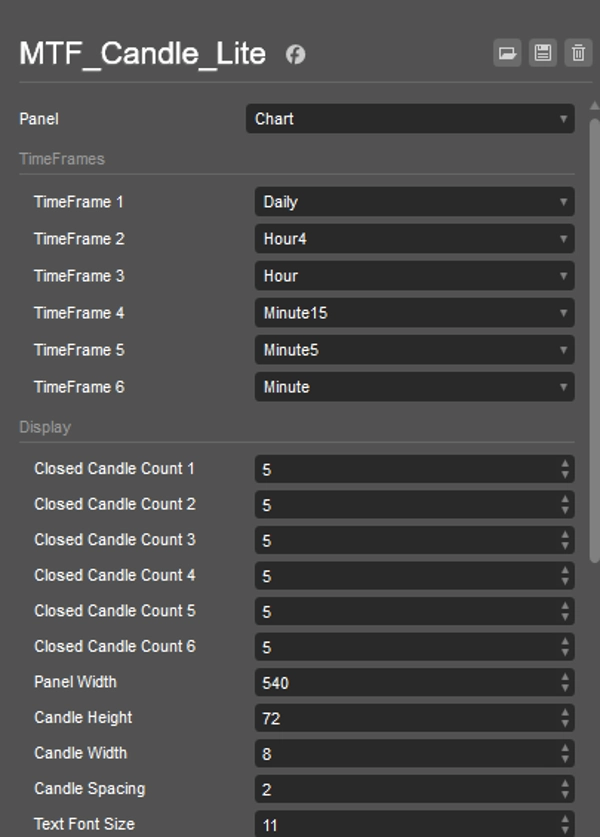
- Displays up to six timeframes in one compact panel.

- Supports standard timeframes and tick-based timeframes.

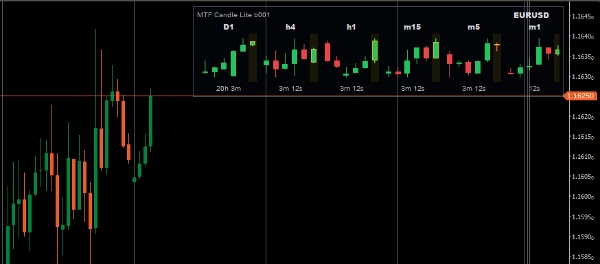
- Shows the current live candle together with recent closed candles.

- Shows the remaining time until the current time-based candle closes.

- Lets you set the number of closed candles for each timeframe.

- Uses clear bullish, bearish and live-candle colors.

- Includes optional OHLC text display.

- Keeps the panel fixed and simple for stable daily use.


Indicator type: Multi-timeframe candlestick visualisation.


Preferred instruments: Major forex pairs, metals, indices and other liquid symbols available in cTrader.


Preferred periods: Useful for intraday and swing-trading chart setups, especially when combining lower

periods such as m1, m5 or m15 with higher periods such as h1, h4 and d1.


Trading use cases:


- Quickly compare candle direction across multiple timeframes.

- Check whether higher-timeframe candles support or conflict with the current chart view.

- Keep a compact multi-timeframe overview visible while focusing on the main chart.

- Use as a visual confirmation tool alongside your own strategy, trend analysis or price-action rules.


Important limitations:


- This free version does not save or restore panel coordinates.

- The previous display position is not guaranteed after parameter changes, chart changes, template reloads,

indicator removal and re-adding, or cTrader restart.

- Running multiple instances of this indicator on the same chart is not supported or guaranteed.

- This indicator is a visual analysis tool only. It does not provide financial advice or guaranteed trading

results.


Trading involves risk. Past performance does not guarantee future results.
Podsumowanie

Profil wskaźnika
Kategoria wskaźnika
Trend
Typ wyjścia
Wizualizacja
Wymagania dotyczące danych
Tylko słupki

Dyskusja

Opinie klientów

0.0
Opinie: 0
Opinie klientów
Ten produkt nie ma jeszcze opinii. Wypróbowałeś(-aś) go już? Bądź pierwszy(-a) i powiedz o tym innym!

Częste pytania

Support & Resistance
Produkty dostępne za pośrednictwem cTrader Store, w tym boty handlowe, wskaźniki i wtyczki, dostarczane są przez deweloperów zewnętrznych i udostępniane wyłącznie w celach informacyjnych oraz w celu zapewnienia dostępu technicznego. cTrader Store nie jest brokerem i nie zapewnia doradztwa inwestycyjnego, nie udziela spersonalizowanych rekomendacji ani nie gwarantuje przyszłych wyników.

Możesz także polubić

Wskaźnik
ATR
RSI
+5
Dual confirmation RSI + EMA crossover signals with visual alerts and dynamic ATR offsets.
Logo „Order Block”
Najwyżej oceniane
4.8
(5)
$19
Wskaźnik
ATR
RSI
+7
Identify bullish and bearish Order Blocks to spot key support/resistance levels and potential trend reversals! 📈🔄
Wskaźnik
MACD
Prop
+14
Enhance MACD Histogram! Visualize bull and bear price changes with vibrant colors for clearer, more insightful trading.
Logo „ZigXRay”
Najwyżej oceniane
4.6
(5)
$29
/
$49
Wskaźnik
CHOCH
Key Levels
+5
ZigZag Market Structure Identifier - Multi-Layer Scanner: Convergent Pivot Detection, 4-TF Overlay & Naked Chart Mode.
Wskaźnik
VWAP
Volume
+4
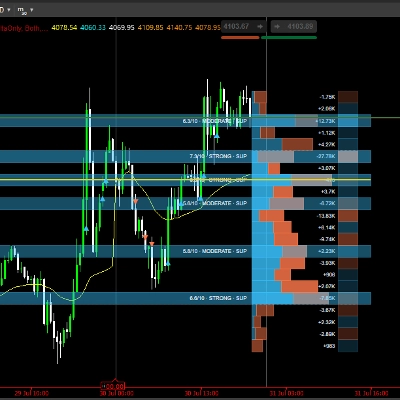
Advanced Order Flow & Volume Profiling for cTrader. Unveil institutional footprints, Delta, and Anchored VWAPs.
Wskaźnik
ATR
Key Levels
+1
Explore 88 harmonic price-pattern variants with interactive chart controls and geometric reference levels.
Wskaźnik
VWAP
Volume
+5
The MA Quant Volume Profile Custom Range is a trading indicator that analyzes volume distribution across the price.
Wskaźnik
ATR
Volume
+3
Volume profile key levels - POC, value area, volume peaks and troughs - with break, rejection and retest signals
Logo „Follow Line”
Najwyżej oceniane
4.5
(6)
Za darmo
Wskaźnik
ATR
MACD
+5
The Follow Line Indicator is a versatile tool designed to identify market trends and provide accurate buy/sell signals.
Wskaźnik
SMC
Prop
+17
Unlock the true intent of market participants with the Classic Proportional Cumulative Volume Delta CVD!
Wskaźnik
Forex
BTCUSD
+11
📈 Adaptive ALMA-Gaussian hybrid trend filter with precision smoothing and clear buy/sell signals.
Wskaźnik
AI
ATR
+20
“Dynamic Swing VWAP — Structure-Anchored, Volatility-Adaptive, Market-Ready.” 🚀
Wskaźnik
Doji
Volume
+5
Instantly spot high-liquidity institutional moves with clean, non-obtrusive triangle alerts on cTrader charts.
Logo „OrderPrice-V3”
Najwyżej oceniane
4.0
(4)
$19
Wskaźnik
RSI
MACD
+2
A straightforward yet effective tool signals entry points for both buying and selling. Include 3 Moving Average
Wskaźnik
RSI
MACD
+5
WaveTrend Oscillator with signal line, spread histogram and OB/OS levels for precise momentum trading.
Wskaźnik
VWAP
Support & Resistance
Trading.FC$_vwap Algo shows VWAP trends, dynamic support/resistance and deviation bands to spot potential trade entries.
Wskaźnik
BOS
CHOCH
+2
Free SMC on your chart: BOS / CHoCH / MSS structure and fair-value gaps. No repaint, and it measures itself.
Wskaźnik
ATR
Wedge
+2
Strong Supertrend Turn Market Movement into a Clear Map Market analysis

Cena

Od 09/05/2026