OAK
Indicator
Version 1.0, Jun 2025
Windows, Mac
"OAK" uploaded image"OAK" uploaded image"OAK" uploaded image
Since 24/02/2025
101.7M
Traded volume
48.74K
Pips won

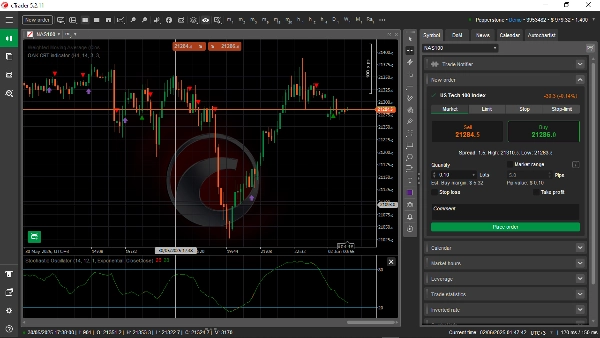
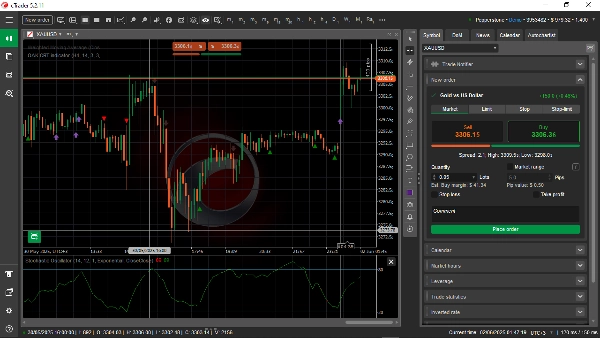
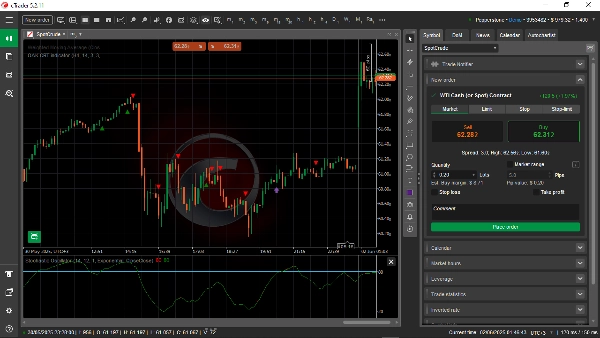
The OAK CRT is a sophisticated trading indicator designed to identify potential market reversals and continuations by combining a unique price action pattern with higher timeframe analysis of market momentum. It visually represents trading signals directly on the chart using distinct arrows and triangles, distinguishing between strong and weak buy/sell opportunities. The indicator helps traders align with prevailing trends and anticipate shifts, providing clear visual cues for entry and exit points.

Important Disclaimer: This indicator is a tool to assist in trading and should not be considered the sole basis for any trading decisions. Trading involves significant risk, and past performance is not indicative of future results. This information is not financial advice.

Copyright © 2025 Edderek Tech by Adrian Kwach. All rights reserved.

0.0
Reviews: 0
Customer reviews
No reviews for this product yet. Already tried it? Be the first to tell others!

You may also like

Indicator
RSI
Breakout
XAUUSD
+6
Volume POC Heatmap
📊 Shows volume by price levels, highlights POC, and key zones. Identifies dynamic support/resistance and imbalances.
AccountType Sample
csdd
Indicator
NAS100
NZDUSD
Breakout
+13
UNO MARKET SESSIONS
🌐 Uno Market Sessions (Optimize your trading window. See the market move in real-time with Uno Market Sessions).
CandleColourFlow_Limited_EURUSD
CandleColourFlow – smart color-coded trend indicator.
Indicator
VWAP
Indices
Commodities
+1
vwap
Custom VWAP Indicator for cTrader
Indicator
NAS100
NZDUSD
XAUUSD
+13
Automatic Fibonatti
Automatically plots Fibonacci retracement levels using the highest and lowest points of a customizable time range
Indicator
Indices
AI
Machine Learning Momentum Index
The Machine Learning Momentum Index (MLMI) represents the next step in oscillator trading.
Indicator
NAS100
NZDUSD
Breakout
+12
Samurai Breakout Pro II
⚔️Full breakout trading workstation: session box, EP/TP/SL levels, on-chart ✓/✗ outcomes, pro-level analytics and more⚔️
Indicator
Indices
Stocks
Commodities
+2
Volume Profile - Updated
Volume distribution analysis with Market Profile TPO integration.
Indicator
Indices
Prop
Stocks
+5
New Way Sar - Free
The Parabolic SAR, or "Stop and Reverse," is a dynamic technical analysis tool.
Indicator
NAS100
NZDUSD
RSI
+11
Pattern Signal Forex
Indicator pattern signal moment
Indicatore utbot
L'indicatore UTBot è uno strumento di analisi tecnica che crea una linea di trailing stop dinamica basata sull'ATRT
Since 24/02/2025
101.7M
Traded volume
48.74K
Pips won