
Description
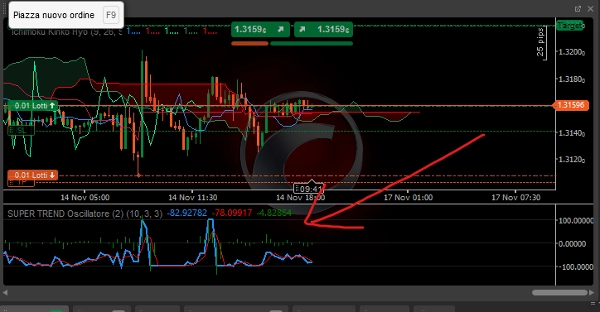
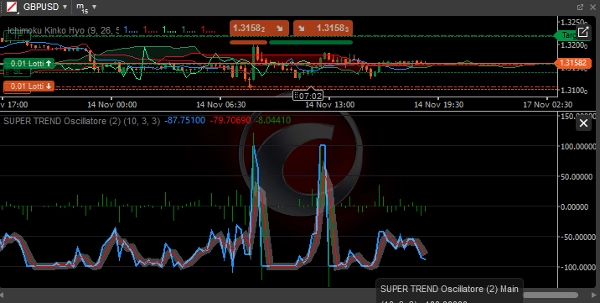
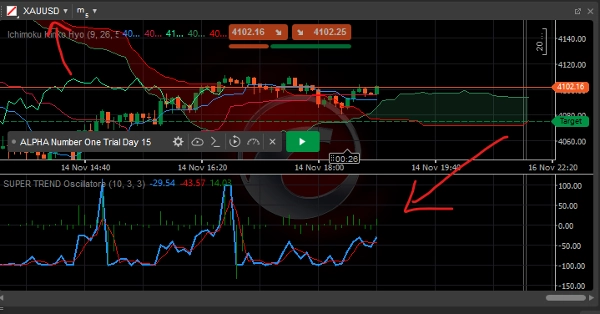
SUPER TREND Oscillatore
Simplified SuperTrend Oscillator - Complete Description
Overview
The Simplified SuperTrend Oscillator is an advanced technical indicator for cTrader that transforms the classic SuperTrend into a visual oscillator, making it easy to identify trend direction, strength, and reliability.
Main Components
1. Main Line (Blue)
- Function: Shows the normalized distance between price and SuperTrend line
- Calculation:
((Price - SuperTrend) / (ATR × Multiplier)) × 100 - Interpretation:
- > 0: Bullish trend (price above SuperTrend)
- < 0: Bearish trend (price below SuperTrend)
- Range: From -100 to +100
2. Signal Line (Red)
- Function: Simple moving average of the main line
- Period: Customizable (default 3 periods)
- Usage: Filters market noise and confirms signals
3. Histogram (Gray)
- Function: Difference between main line and signal line
- Interpretation:
- Positive: Bullish momentum accelerating
- Negative: Bearish momentum accelerating
- Zero crossover: Potential momentum reversals
Configurable Parameters
SuperTrend Parameters:
- ATR Period: Period for Average True Range calculation (default: 10)
- Multiplier: Multiplier for SuperTrend bands (default: 3.0)
Oscillator Parameters:
- Signal Period: Period for signal line (default: 3)
Signal Interpretation
Trend Conditions:
- Strong Bullish Trend:
- Main > +50
- Main > Signal
- Positive histogram
- Strong Bearish Trend:
- Main < -50
- Main < Signal
- Negative histogram
- Ranging Market:
- Main between -30 and +30
- Frequent line crossovers
Trading Signals:
Long Entry:
- Main crosses above 0
- Histogram turns positive
- Signal line confirms bullish
- Main above +20 for momentum
Short Entry:
- Main crosses below 0
- Histogram turns negative
- Signal line confirms bearish
- Main below -20 for momentum
Exit/Take Profit:
- Long: Main > +80 (overbought) or cross below Signal
- Short: Main < -80 (oversold) or cross above Signal
Advantages of Simplified Version
1. Optimized Performance
- More efficient calculations
- Lower resource consumption
- Faster response to price changes
2. Ease of Use
- Reduced essential parameters
- Immediate visual signals
- Easy interpretation even for beginner traders
3. Reliability
- Less susceptible to noise
- Cleaner and more defined signals
- Reduced false signals compared to classic SuperTrend
Usage Strategies
Trend-Following Strategy:
- Entry: Main > 0 for long, Main < 0 for short
- Filter: Histogram same sign as Main
- Exit: Sign reversal or extreme levels reached
Momentum Strategy:
- Entry: Main > +30 (long) or Main < -30 (short)
- Confirmation: Histogram accelerating
- Exit: Momentum deceleration (histogram decreasing)
Mean Reversion Strategy:
- Entry: Main > +80 (short) or Main < -80 (long)
- Confirmation: Histogram reversal
- Exit: Return toward neutral zone
Optimal Market Conditions
Trending Markets:
- High efficiency
- Prolonged signals
- Fewer whipsaws
Ranging Markets:
- Reduce lot size
- Extend timeframe
- Use as momentum filter
Best Practices
Recommended Timeframes:
- Intraday: M15 - H1
- Swing Trading: H4 - D1
- Position Trading: W1 - MN
Risk Management:
- Stop Loss: 1.5-2 × ATR
- Take Profit: 2-3 × Risk
- Position Size: 1-2% per trade
Additional Confirmations:
- Multiple timeframe alignment
- Volume confirmation
- Key support/resistance levels
Limitations
Considerations:
- Inherent lag (trend-following indicator)
- Reduced performance in ranging markets
- Need for confirmations in low volatility
Recommendations:
- Combine with price action analysis
- Use as filter, not standalone system
- Demo test before live use
This oscillator represents a powerful tool for identifying strong trends and filtering false signals while maintaining operational simplicity suitable for both beginner and experienced traders.
Summary
Customer reviews
5 | 67 % | |
4 | 33 % | |
3 | 0 % | |
2 | 0 % | |
1 | 0 % |


