

Description
Deviation Trend Profile Indicator
A trend tracking tool that shows price movement areas and where prices spend most of their time, with colour-changing signals and sound alerts when trends switch direction.
🎯 HOW IT WORKS
Trend Detection via SMA Slope: Spots trend changes when the average price line moves up or down past a 0.1 limit, catching momentum shifts as they happen.
Standard Deviation Zones: Creates ±1, ±2, and ±3 price bands around the average using ATR, building flexible zones that adjust to how wild or calm the market is.
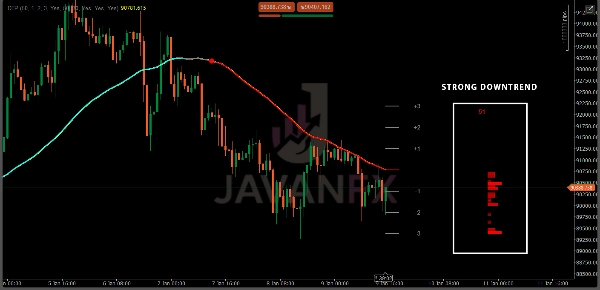
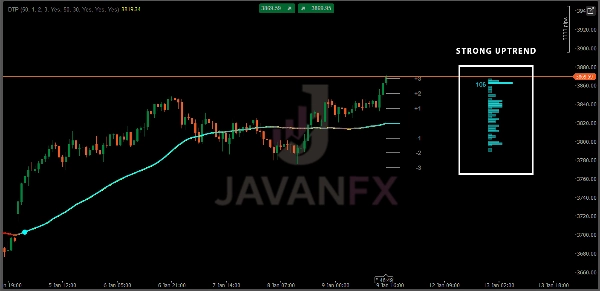
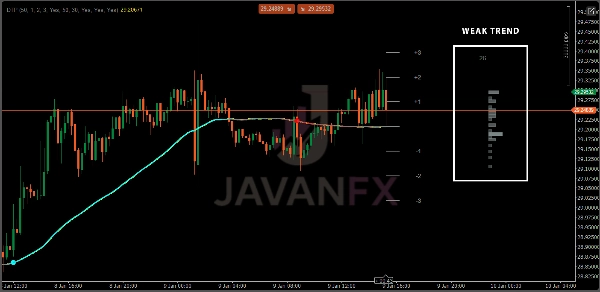
Trend Distribution Profile: Builds a sideways bar chart that shows how often price closed in each zone during the current trend, revealing where price likes to stay.
🔵 FEATURES
Trend Signals: Quick change markers using coloured circles when trends reverse, making it easy to see when momentum flips.
SMA Gradient Colouring: The average line changes colour based on which way it's moving—from red (falling) to cyan (rising) for instant visual feedback.
Audio Alerts: Optional sound notifications when new up or down trends start, so you never miss important market changes.
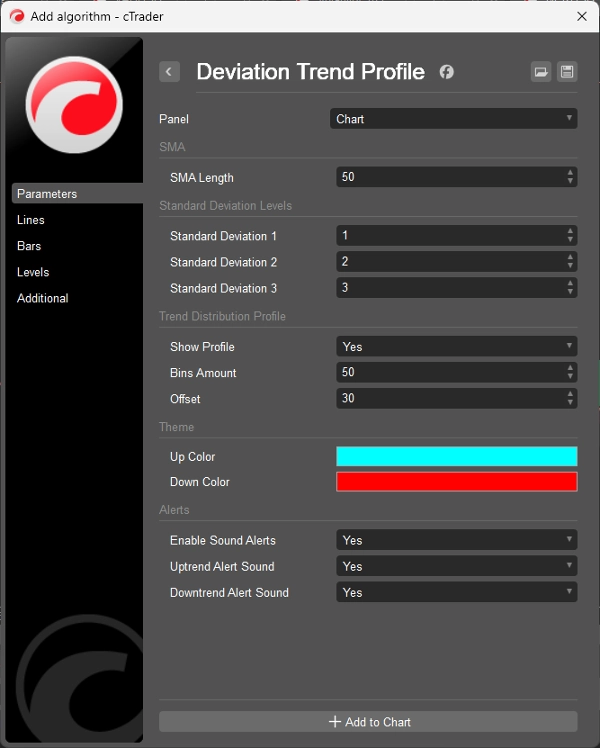
Easy to Adjust: Change the average length, zone sizes, chart bars, and colours to fit your trading style.
⚠️ DISCLAIMER
This indicator is for educational and informational purposes only. It does not guarantee profits or predict future price movements. Trading involves significant risk of loss, and past performance does not indicate future results. Always use proper risk management, conduct your own analysis, and never trade with money you cannot afford to lose. The creator is not responsible for any trading losses incurred from using this tool.
Summary
A sideways bar chart visualizes the distribution of closing prices within these zones during the current trend, highlighting price concentration areas. Key features include color-coded trend signals with circles that mark trend reversals, SMA line color changes reflecting trend direction (red for falling, cyan for rising), and optional audio alerts for new trend initiations. Users can customize parameters such as average length, zone sizes, chart bars, and colors to suit individual trading preferences.
This tool supports analysis across multiple markets including Forex, stocks, indices, commodities, and cryptocurrencies, and is applicable to various trading strategies like scalping and breakout trading. It provides visual and auditory cues to assist traders in monitoring trend shifts and price behavior within defined volatility zones.
Discussion
Customer reviews
5 | 60 % | |
4 | 40 % | |
3 | 0 % | |
2 | 0 % | |
1 | 0 % |
FAQ






























Price