Description
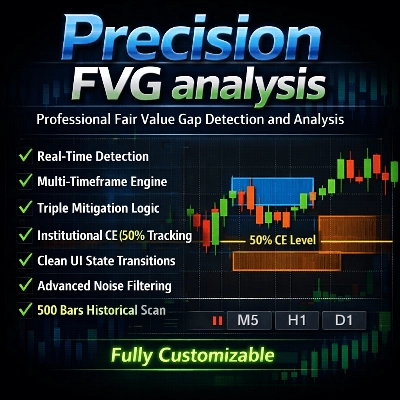
Precision FVG Analysis - Professional Fair Value Gap Indicator
Overview
Precision FVG Analysis is a powerful and flexible Fair Value Gap (FVG) detection indicator designed for serious traders who utilize Smart Money Concepts (SMC) and ICT methodologies. This advanced indicator automatically identifies, tracks, and visualizes Fair Value Gaps across multiple timeframes with sophisticated mitigation tracking capabilities.
Fair Value Gaps represent imbalances in the market where price moved too quickly, leaving inefficiencies that often get revisited. Understanding and trading these gaps is crucial for modern price action traders.
Key Features
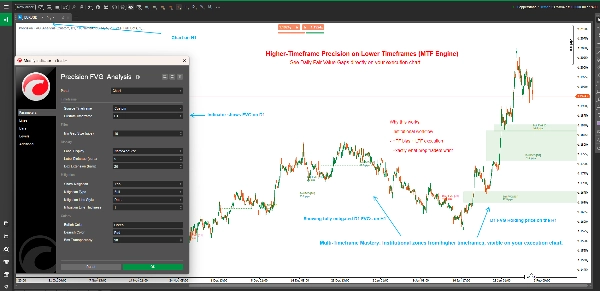
🎯 Multi-Timeframe Analysis
- Adaptive Timeframe Detection: Choose to display FVGs from the current chart timeframe or any custom timeframe
- Cross-Timeframe Trading: View higher timeframe FVGs on lower timeframe charts for better trade context
- Smart Timeframe Labels: Automatic timeframe identification in labels when using custom timeframes
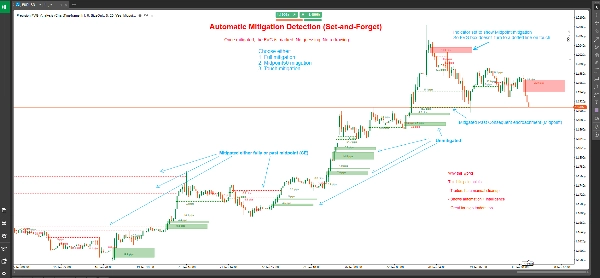
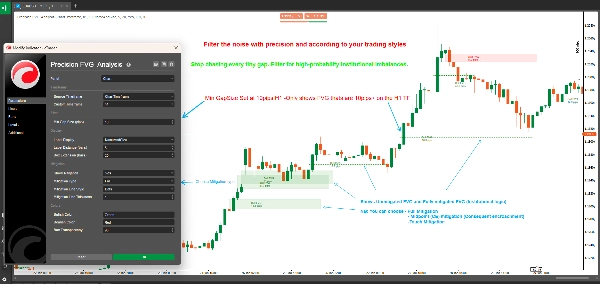
📊 Advanced Mitigation Tracking
- Three Mitigation Types:
- Full Mitigation: Price completely fills the entire gap (most conservative)
- 50% Midpoint (CE): Price reaches the Consequent Encroachment level (balanced approach)
- Touch Mitigation: Price touches the gap boundary (most sensitive)
- Visual State Changes: Unmitigated FVGs display as filled boxes; mitigated FVGs convert to dotted lines
- Precise Mitigation Marking: Shows exact candle where mitigation occurred
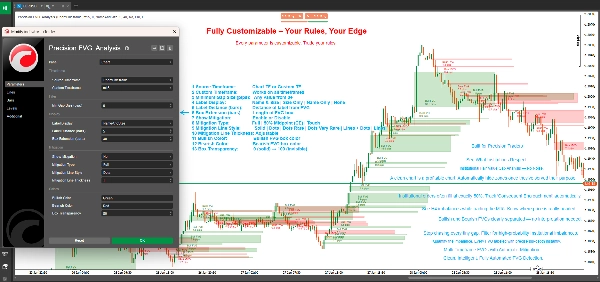
🎨 Fully Customizable Display
- Flexible Box Extension: Control how far FVG boxes extend into the future (0-500 bars)
- Smart Labeling System: Choose from four label modes:
- Name and Size: Full details with FVG type and pip size
- Size Only: Just the gap size in pips
- Name Only: FVG type identification
- None: Clean chart with no labels
- Custom Colors: Separate bullish and bearish color schemes
- Adjustable Transparency: Box transparency from 0-100%
- Mitigation Line Customization: Choose line style and thickness for mitigated FVGs
⚙️ Professional Filtering
- Minimum Gap Size Filter: Set minimum pip requirement to filter out insignificant gaps
- Automatic Detection: Real-time FVG identification on every new candle close
- Historical Scanning: Automatically scans up to 500 historical bars on initialization
What are Fair Value Gaps?
Fair Value Gaps (FVGs) occur when there is a price inefficiency between three consecutive candles:
Bullish FVG: Forms when the current candle's low is higher than the candle from two bars ago's high, with the middle candle closing above that high. This creates an upward gap that often acts as support.
Bearish FVG: Forms when the current candle's high is lower than the candle from two bars ago's low, with the middle candle closing below that low. This creates a downward gap that often acts as resistance.
These gaps represent areas where aggressive buying or selling occurred, leaving price imbalances that the market frequently revisits for "fair value" before continuing in the original direction.
Understanding Mitigation Types
Full Mitigation (Conservative)
- Bullish FVG: Mitigated when price trades below the bottom of the gap
- Bearish FVG: Mitigated when price trades above the top of the gap
- Use Case: Confirmation that the gap has been completely filled, suitable for swing traders and confirmation-seeking strategies
50% Midpoint / CE (Balanced)
- Bullish FVG: Mitigated when price reaches or crosses below the midpoint
- Bearish FVG: Mitigated when price reaches or crosses above the midpoint
- Use Case: The Consequent Encroachment (CE) level is often where institutions place orders, making this ideal for entries with good risk-reward
Touch Mitigation (Aggressive)
- Bullish FVG: Mitigated when price touches or crosses the top boundary
- Bearish FVG: Mitigated when price touches or crosses the bottom boundary
- Use Case: Early warning system for traders who want to catch reactions at FVG boundaries, ideal for scalping and quick entries
How to Use
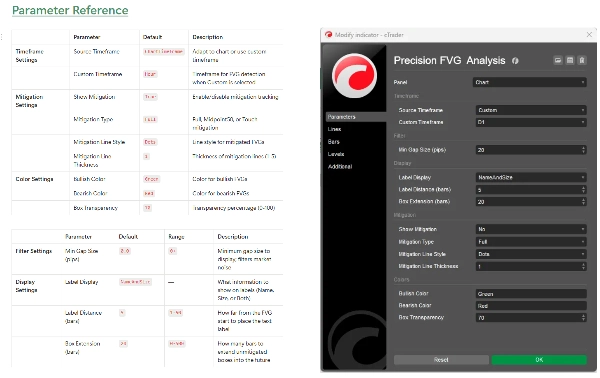
Basic Setup
- Add Precision FVG Analysis to your chart
- Set your preferred Source Timeframe:
- Choose "ChartTimeframe" to detect FVGs on your current chart
- Choose "Custom" and select a specific timeframe (e.g., H4, D1) to see higher timeframe FVGs
- Configure Min Gap Size to filter out small, insignificant gaps (recommended: 2-5 pips for forex)
Mitigation Configuration
- Enable Show Mitigation to activate mitigation tracking
- Select your Mitigation Type based on your trading style:
- Day traders and scalpers: Consider "Touch" or "Midpoint50"
- Swing traders: Use "Full" for confirmation
- Customize mitigation line appearance with Line Style and Thickness
Visual Customization
- Set Box Extension to control how far boxes project (20 bars default)
- Choose your Label Display preference
- Adjust Bullish Color and Bearish Color to match your chart theme
- Fine-tune Box Transparency for optimal visibility
Trading Strategies
Strategy 1: Higher Timeframe FVG with Lower Timeframe Entry
- Set indicator to H4 or D1 timeframe on a M15 or M5 chart
- Identify unmitigated higher timeframe FVGs
- Wait for price to approach the FVG on lower timeframe
- Look for lower timeframe confirmation (candlestick patterns, order blocks, etc.)
- Enter when price reaches your chosen mitigation level
Strategy 2: FVG Confluence Zones
- Use multiple instances of the indicator with different timeframes
- Identify areas where multiple timeframe FVGs overlap
- These confluence zones offer high-probability trade locations
- Use mitigation tracking to time your entries precisely
Strategy 3: Breakout Confirmation
- Identify key support/resistance levels
- Watch for FVG formation during breakouts
- Unmitigated FVGs in the direction of breakout suggest continuation
- Mitigated FVGs suggest potential failed breakout or reversal
Strategy 4: Mitigation-Based Scalping
- Use Touch Mitigation on lower timeframes (M1, M5)
- Enter immediately when FVG is touched
- Target previous swing high/low
- Use tight stops below/above the FVG
Technical Specifications
- Platform: cTrader
- Type: Overlay Indicator
- Calculation: Real-time on bar close
- Historical Bars: Scans up to 500 bars on initialization
- Maximum Active FVGs: 500 concurrent gaps
- Resource Usage: Lightweight and optimized for performance
Best Practices
General Trading Guidelines
- Combine with Other Concepts: FVGs work best when combined with order blocks, liquidity pools, and market structure
- Respect Market Context: Higher timeframe FVGs carry more weight than lower timeframe ones
- Use Multiple Timeframes: Layer different timeframe FVGs for confluence
- Risk Management: Always use proper stop losses; not all FVGs will hold
Optimization Tips
- Adjust Min Gap Size: Set based on your instrument's average volatility
- Box Extension: Longer for swing trading (50-100 bars), shorter for day trading (10-20 bars)
- Mitigation Type: Match to your trading timeframe and style
- Label Distance: Adjust based on chart clutter and zoom level
Common Pitfalls to Avoid
- Over-trading: Not every FVG is a trading opportunity
- Ignoring Context: FVGs against strong trends are less reliable
- Wrong Mitigation Type: Scalpers using Full mitigation miss entries; swing traders using Touch get stopped out
- No Confirmation: Always wait for price action confirmation at FVG levels
Frequently Asked Questions
Q: Why do some FVGs disappear immediately? A: When "Show Mitigation" is enabled with "Touch" mitigation, FVGs that are immediately retraced will convert to dotted lines quickly. This is normal behavior.
Q: Can I see multiple timeframe FVGs simultaneously? A: Yes! Add the indicator multiple times to your chart with different custom timeframes for multi-timeframe analysis.
Q: What's the difference between this and other FVG indicators? A: Precision FVG Analysis offers multi-timeframe capability, three mitigation types, and superior visual clarity with state-based rendering (boxes vs lines).
Q: Which mitigation type should I use? A: Start with Midpoint50 (CE) as it balances early signals with reliability. Adjust based on your results and trading style.
Q: Does this work on all instruments? A: Yes, the indicator works on Forex, Indices, Commodities, and Cryptocurrencies. Adjust the "Min Gap Size" parameter based on instrument volatility.
Q: How far back does historical scanning go? A: The indicator scans up to 500 bars on initialization, providing comprehensive historical context.
Support and Updates
This indicator is actively maintained and updated. Users receive:
- Regular updates with new features
- Performance optimizations
- Bug fixes and improvements
- Documentation updates
For questions, suggestions, or support, please contact through the cTrader store messaging system.
Disclaimer
Trading involves substantial risk of loss and is not suitable for all investors. Past performance is not indicative of future results. This indicator is a tool for analysis and does not constitute financial advice. Always practice proper risk management and never risk more than you can afford to lose.
Version History
Version 1.0 (Current)
- Multi-timeframe FVG detection
- Three mitigation types (Full, Midpoint50, Touch)
- Visual state changes (boxes to dotted lines)
- Customizable colors and transparency
- Flexible labeling system
- Historical scanning (500 bars)
- Real-time detection and tracking
Precision FVG Analysis - Elevate your Fair Value Gap trading to the professional level.
Summary
Key features include adaptive multi-timeframe detection, allowing users to view FVGs from the current or custom timeframes, and advanced mitigation tracking with three types: Full Mitigation (complete gap fill), 50% Midpoint (Consequent Encroachment), and Touch Mitigation (gap boundary touch). Visual states change accordingly, with unmitigated gaps shown as filled boxes and mitigated ones as dotted lines, including precise candle marking of mitigation events.
The indicator offers extensive customization options such as box extension length, label display modes (name, size, both, or none), separate bullish/bearish color schemes, transparency control, and mitigation line styling. It filters gaps by minimum size and scans up to 500 historical bars on initialization for comprehensive context.
Applicable to Forex, Indices, Commodities, Cryptocurrencies, and Stocks, it supports various trading strategies including multi-timeframe analysis, confluence zones, breakout confirmation, and mitigation-based scalping. The tool operates in real-time on bar close and is optimized for performance with up to 500 active gaps tracked concurrently.
Customer reviews
5 | 100 % | |
4 | 0 % | |
3 | 0 % | |
2 | 0 % | |
1 | 0 % |


!["[Stellar Strategies] Market Session Ultimate" logo](https://cdn.ctrader.com/image/webp/61ffd537-0125-4246-9e72-42eca1791d64_28232)


