present
Sign up and get $50 off your first purchase
Trading product for Volume_Momentum_HeatMap-Liquidity-style Indicator Scalping Key Levels, image 1
Volume_Momentum_HeatMap-Liquidity-style
Indicator
Version 2.0, Apr 2026
Windows, Mac
4.5
Reviews: 4
Trading product for Volume_Momentum_HeatMap-Liquidity-style Indicator Scalping Key Levels, image 2
Trading product for Volume_Momentum_HeatMap-Liquidity-style Indicator Scalping Key Levels, image 3
Trading product for Volume_Momentum_HeatMap-Liquidity-style Indicator Scalping Key Levels, image 4
Trading product for Volume_Momentum_HeatMap-Liquidity-style Indicator Scalping Key Levels, image 5
Since 23/04/2025
35.65M
Traded volume
4.63K
Pips won
2
Sales

Description

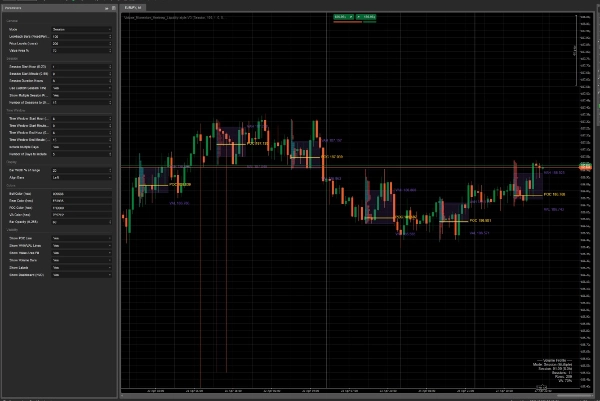
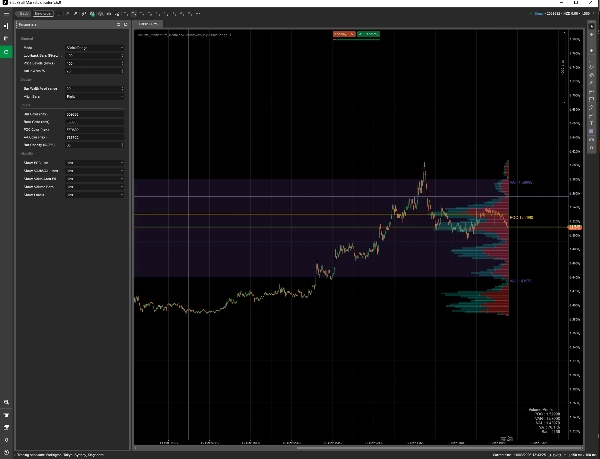
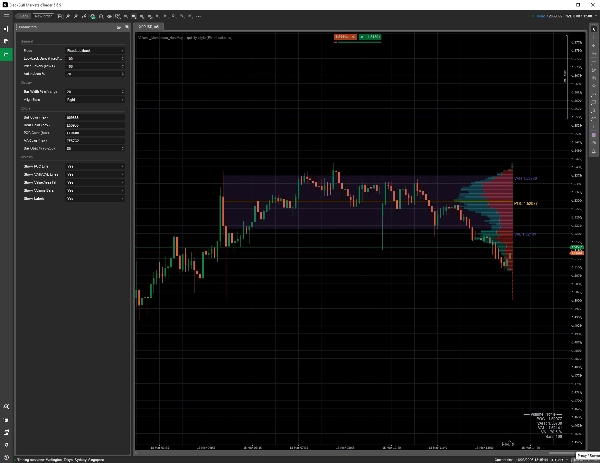
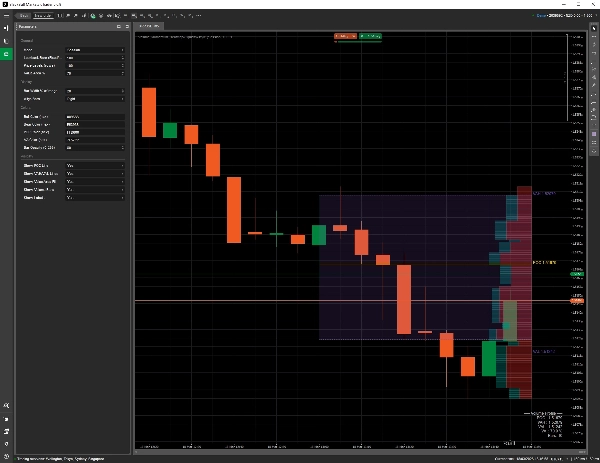
Volume Profile HeatMap is a cTrader chart indicator for analysing where trading activity has concentrated across price levels. It draws a volume-profile style heatmap with POC, value area, and optional visual trade scenario markers.


What it does:

- Displays a volume-profile style heatmap directly on the chart

- Highlights POC, VAH, VAL, high-volume nodes, and low-volume areas

- Supports visible range, fixed lookback, session, and time-window modes

- Can show multiple session profiles

- Draws optional value area fill, extended value area zones, labels, and dashboard information

- Includes optional pattern labels and signal arrows for visual trade planning

- Draws visual entry, stop, and target scenarios when enabled


Trading approach:

The indicator is designed for traders who use volume concentration, value area, and session context to plan manual trades. It helps identify zones where price has previously accepted or rejected value, but it does not guarantee that those zones will hold in live market conditions.


Key parameters:

- Profile mode

- Lookback bars

- Session start time and duration

- Number of sessions to show

- Pattern recognition and signal arrows

- Time-window selection

- Number of price levels

- Value area percentage

- Bar width and alignment

- POC, VAH, VAL, value area fill, labels, and dashboard visibility

- Risk/reward ratio for visual trade scenarios


Who it is for:

- Intraday traders who use value area and POC levels

- Traders looking for visual support and resistance context

- Manual traders who want a volume-profile style overlay inside cTrader

- Strategy testers who want to review session behaviour and potential reaction zones


Important limitations:

This is an indicator, not a trading robot. It does not send live orders. The trade markers are visual scenarios only. The indicator uses chart/broker volume data available inside cTrader, which may differ from centralised exchange volume or futures order-flow data.


Risk note:

Trading involves risk. POC, VAH, VAL, HVN, and LVN zones are analysis tools, not guaranteed reversal or breakout levels. Test settings on demo and use independent risk management.


Summary

AI summary
Volume_Momentum_HeatMap-Liquidity-style is a cTrader chart indicator designed to visualize trading volume concentration across price levels using a volume-profile heatmap. It highlights key volume-based zones such as Point of Control (POC), Value Area High (VAH), Value Area Low (VAL), High Volume Nodes (HVN), and Low Volume Nodes (LVN). The indicator supports multiple profile modes including visible range, fixed lookback, session, and customizable time windows, allowing users to display one or multiple session profiles.

Key features include optional value area fills, extended value area zones, labels, and a dashboard for summary information. It also offers pattern recognition with signal arrows and visual trade scenario markers such as entry, stop, and target levels based on configurable risk/reward ratios. Users can adjust parameters like profile mode, lookback bars, session timing, number of price levels, and visibility of various elements to tailor the analysis.

This tool is intended for intraday and manual traders who utilize volume profile, value areas, and session context to identify support and resistance zones and plan trades visually. It relies on chart volume data available in cTrader and does not execute trades automatically. The indicator serves as an analytical overlay to assist in trade planning and session behavior review.
Indicator profile
Indicator category
Momentum
Output type
Visualisation
Signals
Filter
Data requirements
Volume
Supported signals
Volatility
Level touch
Session opening range

Customer reviews

4.5
Reviews: 4
5
50 %
4
50 %
3
0 %
2
0 %
1
0 %
Customer reviews
March 31, 2026
Not some auto win thing, but it has a clear role. It helps with smart money style analysis, while the weak spot is that zones still need manual validation. Early sizing should stay modest until the journal looks stable.
March 24, 2026
Tbh the value is mostly in filtering bad ideas. I still would not trust it live without checking the chart myself. The weak spot shows up when risk stops matching the setup.705 caution area.
March 22, 2026
the product feels more useful when the plan is already written down. A 97 setup run on daily close keeps the review grounded.
March 22, 2026
After 3 sessions, the useful part became clearer. 20 FVG reactions was enough to see whether it helped, and 0.5 mitigation kept the test grounded.

Discussion

FAQ

Scalping
Key Levels
Volume
Support & Resistance
Products available through cTrader Store, including trading bots, indicators and plugins, are provided by third-party developers and made available for informational and technical access purposes only. cTrader Store is not a broker and does not provide investment advice, personal recommendations or any guarantee of future performance.

More from this author

Indicator
Signal
Trades Opening Range Breakouts Indicator with dynamic stops/targets adapting to market volatility.

You may also like

Indicator
ADX
EMA
+4
Displays Dr Chan Theory chart structures for supported Pepperstone cTrader symbols and timeframes.
Indicator
Imbalance
Risk Dashboard
+2
FX‑DESK RISK MANAGEMENT — Cross‑Asset Correlation Heatmap, Info Panel & Trade Signals
Indicator
Forex
Signal
Literally the best Linear Regression Indicator out there. 8 distinct mathematical models and more!
Indicator
ATR
SMC
+7
SMC indicator for cTrader detecting order blocks, fair value gaps, liquidity sweeps and market structure with buy/sell
Indicator
AI
ATR
+26
The Triple Momentum indicator for cTrader is a versatile trend-following tool.
Indicator
Volume
Moving Average
Multi-Timeframe Rolling Volatility Indicator - Smart Volatility Breakout System
Indicator
Prop
Forex
+2
Vision - Advanced Session Indicator
Indicator
VWAP
Volume
+3
Track hidden trading activities to be on the right side of the market.
Indicator
Forex
BTCUSD
+5
Cross EMA Pro – Trend Reversal Indicator
Indicator
Prop
Forex
+12
Half Trend Cloud
Indicator
AI
ATR
+27
The Fibonacci Automated Levels Indicator is a smart trading tool that automatically detects the most recent market.
Indicator
Forex
BTCUSD
+11
Master trends with Smart ADX: MTF Scanner, precise Buy/Sell signals, Divergence & clear Exit targets 🎯
Indicator
Forex
EURUSD
+4
This is a tool to help traders open orders/close orders/modify orders quickly with just one click.
Indicator
ADX
ATR
+3
Precision sniper-style confluence entries with graded signals, auto SL/TP & live backtest — 7 presets, MTF bias.
Indicator
ATR
VWAP
+17
Hybrid adaptive trend filter with clean Buy/Sell signals, dynamic bands and zero-repaint analysis.
Indicator
RSI
SMC
+17
Turn WaveTrend Cross into a BTC profit machine precise buy sell signals, smart momentum edge, no lag trading system
Indicator
ATR
Fibonacci
+1
Trading Clock Pro: An all-in-one market timing dashboard designed to help traders understand the market at one Spot.
Indicator
VWAP
Volume
+4
Advanced Order Flow & Volume Profiling for cTrader. Unveil institutional footprints, Delta, and Anchored VWAPs.

Price

Since 23/04/2025
35.65M
Traded volume
4.63K
Pips won
2
Sales