Description
🎯 MaQuantBigTradeDetector
Professional Whale Trade Detection Indicator for cTrader
🚀 Revolutionize Your Trading with Advanced Volume Analysis
MaQuantBigTradeDetector is a cutting-edge trading indicator that identifies institutional-level trades (whale movements) in real-time through sophisticated volume decomposition and statistical analysis. See exactly when the big players are making their moves!
✨ Key Features
🔍 Advanced Volume Decomposition
- Smart Volume Analysis: Automatically separates buying and selling pressure within each candlestick
- Statistical Detection: Uses standard deviation calculations to identify abnormal volume spikes
- Real-time Processing: Instant detection as new bars form
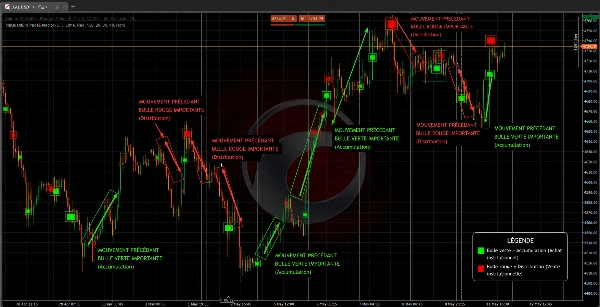
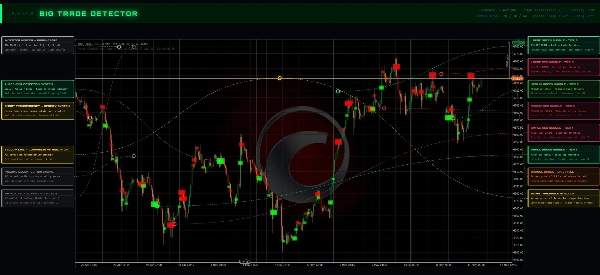
🎨 Visual Bubble System
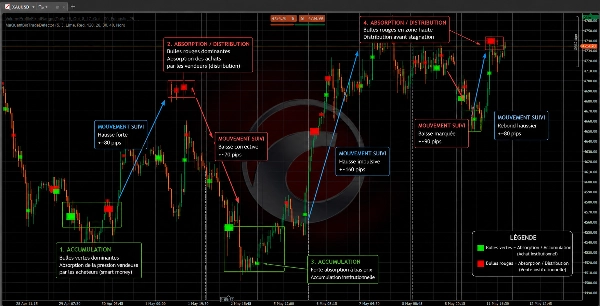
- Three-Tier Detection: Small, Medium, and Large bubbles based on volume intensity
- Color-Coded Signals:
- 🟢 Green Bubbles = Big Buy Orders (Bullish Whale Activity)
- 🔴 Red Bubbles = Big Sell Orders (Bearish Whale Activity)
- Smart Transparency: Larger trades = more opaque bubbles for instant recognition
⚙️ Fully Customizable Settings
Detection Parameters
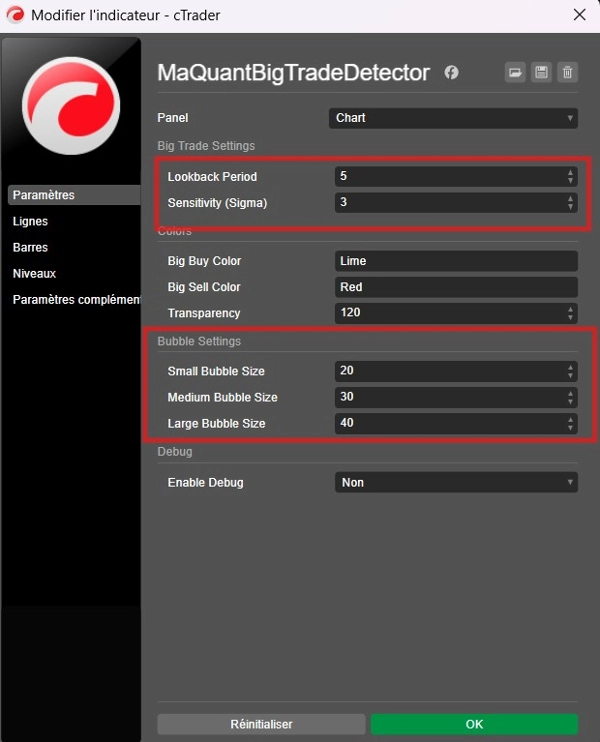
- Lookback Period: Adjustable historical analysis window (Default: 5 periods)
- Sensitivity Control: Fine-tune detection threshold using Sigma multipliers (Default: 3.0)
- Multi-Level Thresholds: Three detection levels for different whale sizes
Visual Customization
- Bubble Sizes: Configurable small (6), medium (10), and large (16) bubble sizes
- Color Schemes: Choose your preferred colors for buy/sell signals
- Transparency Control: Adjust bubble opacity (0-255 range)
- Debug Mode: Optional detailed logging for analysis
🎯 How It Works
1. Volume Analysis Engine
The indicator analyzes each candlestick's volume distribution:
- Buy Volume =
((Close - Low) / Range) × Total Volume - Sell Volume =
((High - Close) / Range) × Total Volume
2. Statistical Comparison
Compares current volume against historical averages:
- Calculates moving averages and standard deviations
- Uses configurable sensitivity thresholds
- Filters out normal market noise
3. Whale Detection Levels
- Tier 1:
Average + (Sensitivity × StdDev)
- Small whale activity - Tier 2:
Average + ((Sensitivity + 1.5) × StdDev)
- Medium whale activity - Tier 3:
Average + ((Sensitivity + 3.0) × StdDev)
- Large whale activity
4. Visual Signals
Places colored bubbles directly on your chart at optimal price levels:
- Buy signals: Positioned between close and low prices
- Sell signals: Positioned between close and high prices
🏆 Trading Advantages
📈 Enhanced Market Timing
- Spot institutional entries before price moves
- Identify support/resistance levels where whales are active
- Confirm breakouts with volume validation
🎯 Improved Entry/Exit Points
- Enter trades alongside institutional money
- Avoid trading against whale movements
- Time your exits when big players are selling
📊 Risk Management
- Understand when smart money is accumulating or distributing
- Avoid false breakouts lacking whale support
- Identify potential reversal zones
💡 Best Practices
Optimal Settings
- Forex Pairs: Sensitivity 2.5-3.5, Lookback 5-10
- Crypto Markets: Sensitivity 3.0-4.0, Lookback 3-7
- Stock Indices: Sensitivity 2.0-3.0, Lookback 7-12
Trading Strategies
- Trend Following: Trade in direction of large bubble clusters
- Reversal Trading: Look for whale accumulation at support/resistance
- Breakout Confirmation: Only trade breakouts with whale volume support
🔧 Technical Specifications
- Platform: cTrader (cAlgo)
- Chart Overlay: Yes - displays directly on price chart
- Real-time Updates: Yes - processes each new bar instantly
- Resource Usage: Optimized for minimal CPU impact
- Compatibility: All timeframes and instruments
🎯 Perfect For
✅ Day Traders seeking optimal entry points
✅ Scalpers looking for institutional backing
✅ Swing Traders identifying accumulation zones
✅ Professional Traders requiring volume confirmation
✅ Algorithmic Traders needing precise volume data
💬 What Traders Say
"Finally, an indicator that shows me what the big players are actually doing. The bubble visualization makes it so easy to spot whale activity!"
"Game-changer for my forex trading. I can now see institutional volume that was invisible before."
"The three-tier system is brilliant - I can distinguish between different levels of whale activity."
🚨 Don't Trade Blind - See The Whales!
Stop guessing where institutional money is flowing. MaQuantBigTradeDetector gives you the insider's view of market volume dynamics.
Ready to Trade with the Whales?
Download MaQuantBigTradeDetector today and transform your trading with professional-grade volume analysis!
Disclaimer: Trading involves risk. Past performance does not guarantee future results. Please trade responsibly.