
Description
What is LTtradingBox?
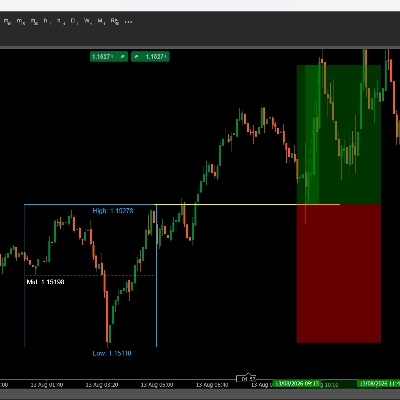
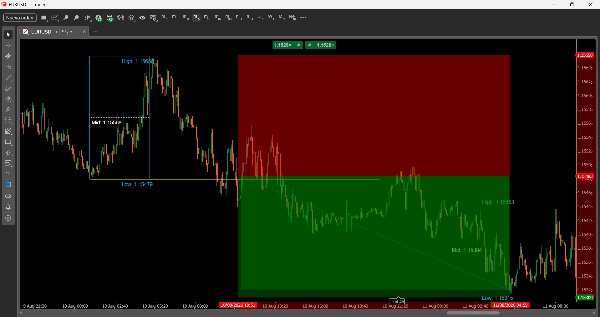
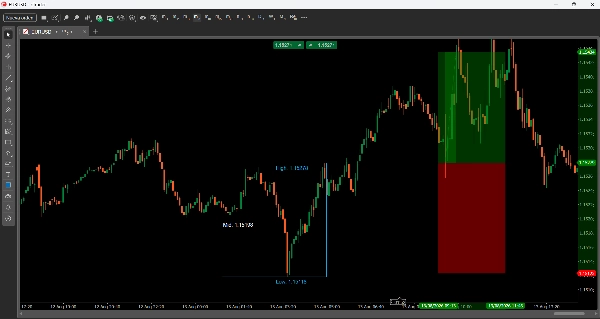
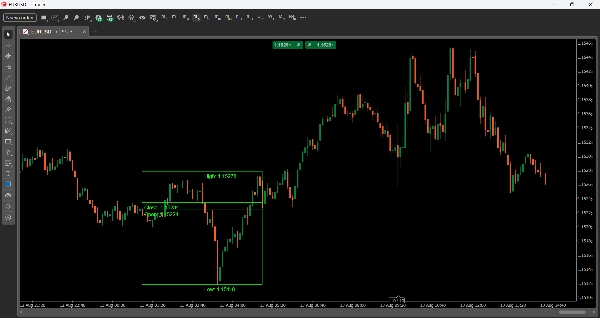
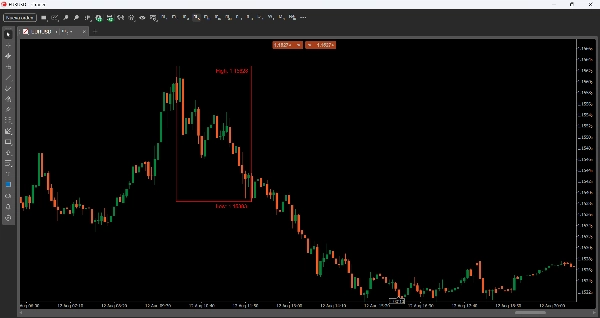
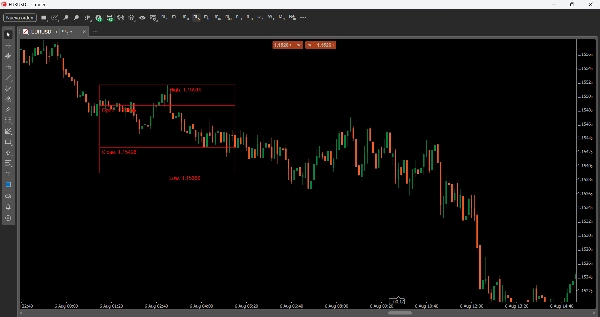
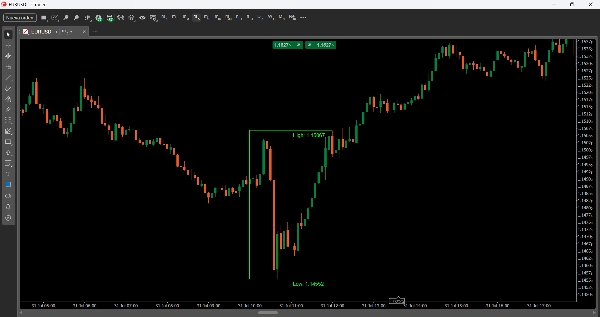
LTtradingBox visually marks the price range (high, low, open, and close) of a time window you define — for example the London or New York session. The box automatically changes color based on that session's outcome: green if it closed bullish, red if it closed bearish, gray if neutral (or whichever colors you choose for each case). It also adds reference lines (Mid Price, Mid Time) and an optional visual fill, helping you spot liquidity zones, accumulation ranges, and key levels to trade at a glance.
Parameters
Time Settings
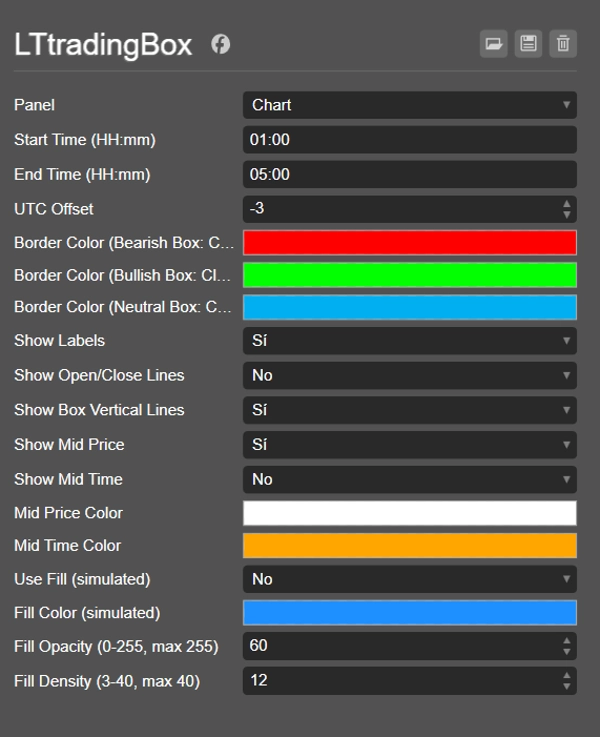
- Start Time (HH:mm) — Start time of the box (24-hour format).
- End Time (HH:mm) — End time of the box.
- UTC Offset — Time adjustment so the box aligns with your local time or the session you want to track (e.g. London, NY, Asia), regardless of your broker's timezone.
Colors
- Border Color (Bearish Box: Close < Open) — Border color when the box closes bearish.
- Border Color (Bullish Box: Close > Open) — Border color when the box closes bullish.
- Border Color (Neutral Box: Close == Open) — Border color when close equals open.
Display Options
- Show Labels — Toggles the text labels showing High, Low, Open, and Close values.
- Show Open/Close Lines — Draws horizontal lines marking the open and close price within the box.
- Show Box Vertical Lines — Enables the full rectangle (4 borders); if disabled, only the High and Low lines are shown.
- Show Mid Price — Draws a dotted line at the midpoint between High and Low.
- Show Mid Time — Draws a vertical line at the box's midpoint in time.
- Mid Price Color / Mid Time Color — Customizable colors for those lines.
Fill (visual fill)
- Use Fill (simulated) — Enables a simulated fill inside the box (using overlaid thin lines).
- Fill Color (simulated) — Fill color.
- Fill Opacity (0-255, max 255) — Transparency level of the fill.
- Fill Density (3-40, max 40) — Number of lines used to simulate the fill (higher density = more solid fill).
Trading Ideas
- Breakout and retest: wait for price to break the box's High or Low, then return to retest that level as support/resistance before entering in the direction of the breakout.
- Reversal at extremes: if price touches the box's High or Low without breaking through with strength, it may signal a rejection and a move toward the opposite side of the box.
- Directional bias by session: the box's color gives you a quick bias (bullish/bearish/neutral) on how that session moved, useful for aligning entries in later sessions.
- Mid Price as a magnet: the midpoint often acts as a rebalancing zone — look for entries when price returns to the Mid after a strong impulsive move.
- Compare consecutive boxes: since each daily box is saved (via its date tag), you can compare the range and bias of several consecutive sessions to spot short-term trends.
Summary
AI summary
LTtradingBox is a customizable trading indicator that visually highlights the price range—high, low, open, and close—within any user-defined time window, such as a specific trading session. The indicator draws a colored box representing this range, automatically changing its border color to green for bullish closes, red for bearish closes, or gray for neutral, with customizable color options. It includes reference lines for the midpoint price and midpoint time, which can be displayed as dotted or vertical lines, aiding in identifying liquidity zones, accumulation areas, and key support/resistance levels.
Users can configure start and end times, apply a UTC offset to align with local or session times, and toggle display options such as labels for price points, open/close lines, full box borders, and visual fills with adjustable color, opacity, and density. The indicator supports trading strategies including breakout and retest of box boundaries, reversal signals at extremes, session-based directional bias, and using the midpoint as a rebalancing zone. It also allows comparison of consecutive session boxes to detect short-term trends. LTtradingBox is designed to assist traders in quickly identifying key levels and market structure within chosen timeframes.
Users can configure start and end times, apply a UTC offset to align with local or session times, and toggle display options such as labels for price points, open/close lines, full box borders, and visual fills with adjustable color, opacity, and density. The indicator supports trading strategies including breakout and retest of box boundaries, reversal signals at extremes, session-based directional bias, and using the midpoint as a rebalancing zone. It also allows comparison of consecutive session boxes to detect short-term trends. LTtradingBox is designed to assist traders in quickly identifying key levels and market structure within chosen timeframes.
Indicator profile
Indicator category
Support & resistance
Output type
Visualisation
Data requirements
Bars only
Supported signals
Breakout
Reversal
Level break
Level touch
Customer reviews
0.0
Reviews: 0
Customer reviews
No reviews for this product yet. Already tried it? Be the first to tell others!
Discussion
FAQ
Key Levels
Support & Resistance
Products available through cTrader Store, including trading bots, indicators and plugins, are provided by third-party developers and made available for informational and technical access purposes only. cTrader Store is not a broker and does not provide investment advice, personal recommendations or any guarantee of future performance.


















Price
Since 10/01/2025