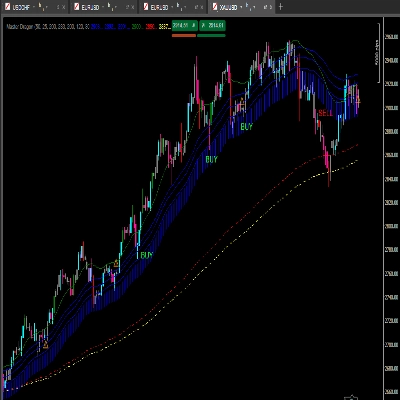
"EMA Dragon Trend" logo
EMA Dragon Trend
"EMA Dragon Trend" uploaded image
86
Sales
5.26K
Free installs
Indicator profile
0.0
Reviews: 0
Customer reviews
No reviews for this product yet. Already tried it? Be the first to tell others!
Products available through cTrader Store, including trading bots, indicators and plugins, are provided by third-party developers and made available for informational and technical access purposes only. cTrader Store is not a broker and does not provide investment advice, personal recommendations or any guarantee of future performance.

More from this author

Order BlockIndicator reversal
Precision Scalper,XAUUSD ,Averages that functions like a multidimensional radar:
34.8%
2.12
Profit factor
5%
Max drawdown
Intelligent negotiations and analysis!
47.3%
3
Profit factor
2%
Max drawdown
Intelligent system, Available any instrument. Profit 12. Drawdown 1%
Volume Profile Price Period and Live VAH,VAL,POC,
Chart Patterns Algo Bot
Profitable low-risk robot, ROI 32% month, live,
36.8%
3.4
Profit factor
7%
Max drawdown
INDICATOR,LIQUIDITY POOLS,ACCURATE SIGNAL, NO DELAY,80% PROBABILITY
PVA Volume Analysis Indicator:Price volume over trend strength and direction
Trend analysis, automatic analysis, position, swingtrader, scalper
Indicator,combines with several strategies.MA locate trends,pullback, signal volumes, reversals, support and resistance
POSITION 5000 Pips: The Ultimate Algorithm for Gold
16.8%
4
Profit factor
5%
Max drawdown

You may also like

This is the first version I offer you for free.
A function demo version of VWAP indicator with std. dev. bands. Expired on 1st Aug, 2025.
Candle Timer & Strength DEMO for cTrader This is a DEMO version of the Candle Timer & Strength indicator. You can use al
Square Matrix Trading System by LudwigICT โ€“ Institutional-Grade Trading Clarity in cTrader
Bollinger Band Cloud, Heiken Ashi, Trend Follower and Parabolic SAR.
Revolutionary Candlestick Visualization
PrimeTrend: ATR trendline detects reversals, plots entry/SL/3 targets. Tune params (speed vs. robustness). Backtest +
Displays live spread and estimated trading cost directly on chart to help assess conditions before entering a trade.
The Red & Green Zone Reversal Indicator detects overbought and oversold market conditions using Bollinger Bands and RSI.
Enhance trading with ATR Bands! Visualize market volatility using dynamic upper and lower ATR bands for precise decision
Reverse engineering: projects stochastic (1-99%) on price to define real market boundaries.
Shows bullish/bearish bias for 5 timeframes in one panel. Three bias methods, alignment summary, fully configurable.
show symbol and time fram, daily net profit percent, daily net profit, and spread ln your chart. consider that timezone
Visualizes potential momentum shifts before market direction changes.
don't move to the end of chart after timeframe changing. it should be better to use for near history. for long history
Pulse Radar is a precision C#-based tool for tracking price momentum and cyclical shifts using adaptive high-speed and s
โ€œDynamic Swing VWAP โ€” Structure-Anchored, Volatility-Adaptive, Market-Ready.โ€ ๐Ÿš€
Visual indicator for identifying momentum reversals. Designed for forex (1h) and stocks (weekly).
86
Sales
5.26K
Free installs