Description
Indicateur de Profil de Tendance de Déviation
Un outil de suivi de tendance qui montre les zones de mouvement des prix et où les prix passent le plus de temps, avec des signaux changeant de couleur et des alertes sonores lorsque les tendances changent de direction.
🎯 COMMENT ÇA FONCTIONNE
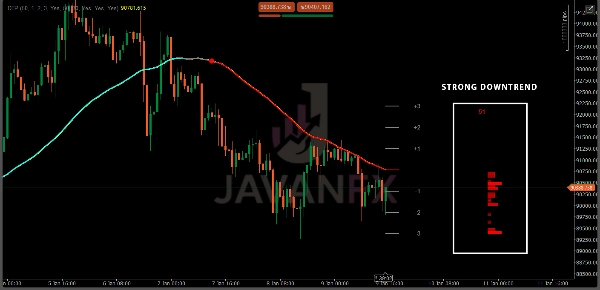
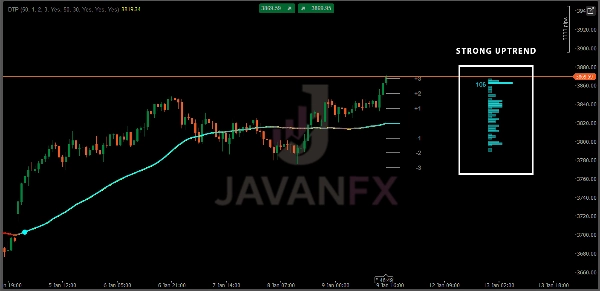
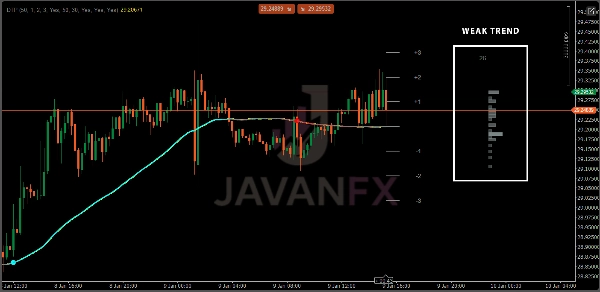
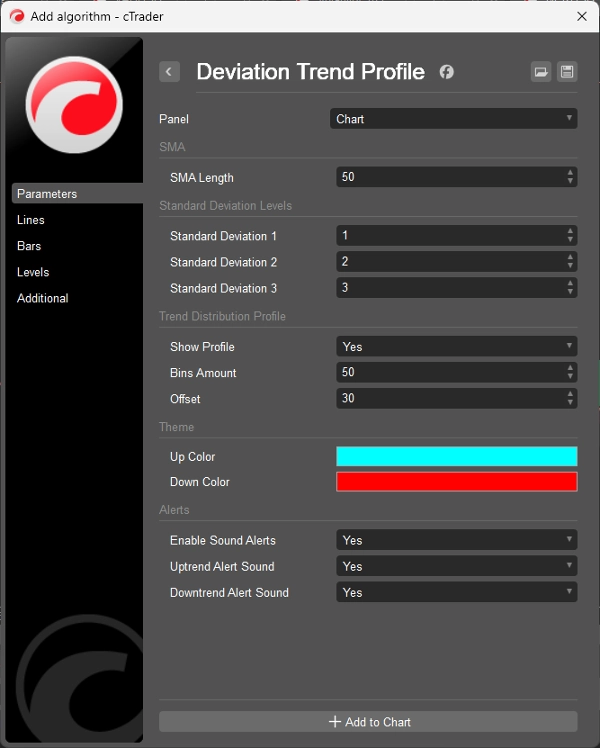
Détection de Tendance via la Pente SMA : Repère les changements de tendance lorsque la ligne de prix moyenne monte ou descend au-delà d'une limite de 0,1, capturant les changements de momentum au moment où ils se produisent.
Zones d'Écart Type : Crée des bandes de prix ±1, ±2 et ±3 autour de la moyenne en utilisant l'ATR, construisant des zones flexibles qui s'ajustent à la volatilité du marché.
Profil de Répartition de la Tendance : Construit un graphique à barres latéral montrant la fréquence à laquelle le prix a clôturé dans chaque zone pendant la tendance actuelle, révélant où le prix aime rester.
🔵 FONCTIONNALITÉS
Signaux de Tendance : Marqueurs de changement rapides utilisant des cercles colorés lorsque les tendances s'inversent, facilitant la visualisation des retournements de momentum.
Coloration du Gradient SMA : La ligne moyenne change de couleur selon sa direction — du rouge (en baisse) au cyan (en hausse) pour un retour visuel instantané.
Alertes Sonores : Notifications sonores optionnelles lorsque de nouvelles tendances haussières ou baissières commencent, pour ne jamais manquer les changements importants du marché.
Facile à Ajuster : Modifiez la longueur moyenne, la taille des zones, les barres du graphique et les couleurs pour adapter à votre style de trading.
⚠️ AVERTISSEMENT
Cet indicateur est uniquement à des fins éducatives et informatives. Il ne garantit pas de profits ni ne prédit les mouvements futurs des prix. Le trading comporte un risque important de perte, et les performances passées ne préjugent pas des résultats futurs. Utilisez toujours une gestion des risques appropriée, effectuez votre propre analyse et ne tradez jamais avec de l'argent que vous ne pouvez pas vous permettre de perdre. Le créateur n'est pas responsable des pertes de trading résultant de l'utilisation de cet outil.
Résumé
A sideways bar chart visualizes the distribution of closing prices within these zones during the current trend, highlighting price concentration areas. Key features include color-coded trend signals with circles that mark trend reversals, SMA line color changes reflecting trend direction (red for falling, cyan for rising), and optional audio alerts for new trend initiations. Users can customize parameters such as average length, zone sizes, chart bars, and colors to suit individual trading preferences.
This tool supports analysis across multiple markets including Forex, stocks, indices, commodities, and cryptocurrencies, and is applicable to various trading strategies like scalping and breakout trading. It provides visual and auditory cues to assist traders in monitoring trend shifts and price behavior within defined volatility zones.
Avis clients
5 | 67 % | |
4 | 33 % | |
3 | 0 % | |
2 | 0 % | |
1 | 0 % |


