Descrição
🚀 Transforme seu Gráfico em um Centro Estratégico de Decisão
Smart Tech Analysis não é apenas um indicador.
É um painel completo de análise inteligente, desenvolvido para traders que buscam clareza, precisão e agilidade na tomada de decisões.
Enquanto a maioria dos indicadores entrega apenas informações isoladas, o Smart Tech Analysis integra:
✔ Tendência
✔ Volume
✔ Fibonacci
✔ Suporte e Resistência
✔ Sinais Técnicos
✔ Recomendações Operacionais
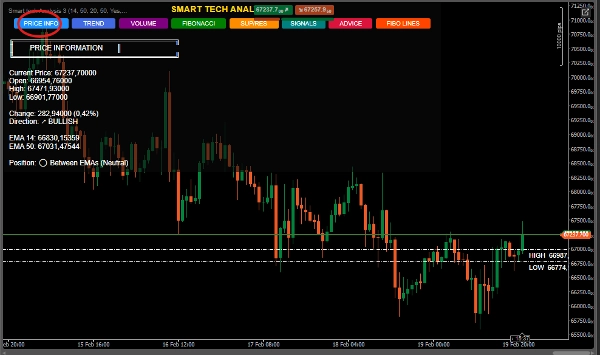
✔ Informações Detalhadas de Preço
Tudo em um único painel dinâmico e interativo.
🔥 A GRANDE DIFERENÇA
🎯 1. Sistema 6-em-1 – Análise Integrada
Você não precisa mais alternar entre múltiplos indicadores.
O Smart Tech Analysis combina:
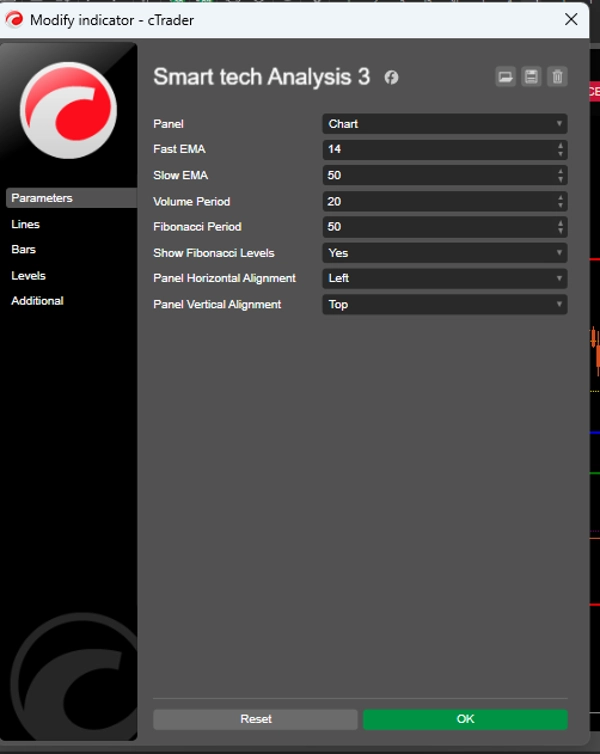
📈 EMAs rápidas e lentas (14 e 50)
📊 Volume com análise comparativa
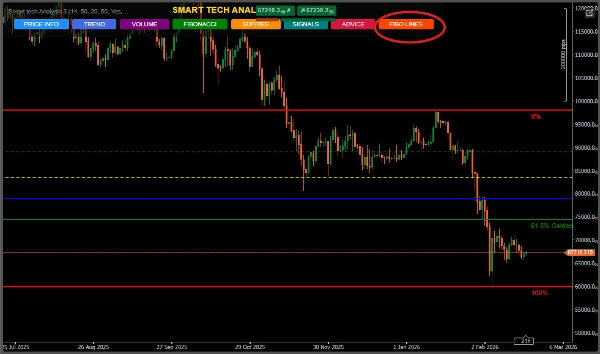
🧩 Fibonacci automático
🛡 Suporte e resistência dinâmicos
🚦 Geração inteligente de sinais
📌 Recomendações com stop e alvo calculados
👉 Isso reduz o ruído visual e aumenta a objetividade.
🧠 2. Painel Interativo Exclusivo
Interface profissional com botões inteligentes:
INFO DE PREÇO
TENDÊNCIA
VOLUME
FIBONACCI
SUP/RES
SINAIS
CONSELHOS
O trader escolhe exatamente o que deseja ver.
📌 Organização.
📌 Controle.
📌 Profissionalismo.
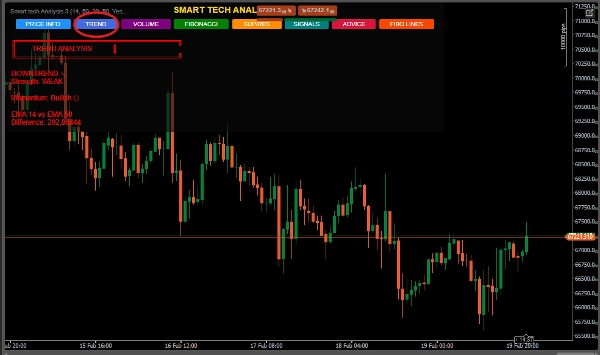
📈 3. Análise de Tendência com Força e Momentum
Não mostra apenas se está subindo ou descendo.
Calcula:
Intensidade da tendência
Força percentual entre EMAs
Classificação: Fraca, Moderada ou Forte
Isso evita entradas fracas em mercados laterais.
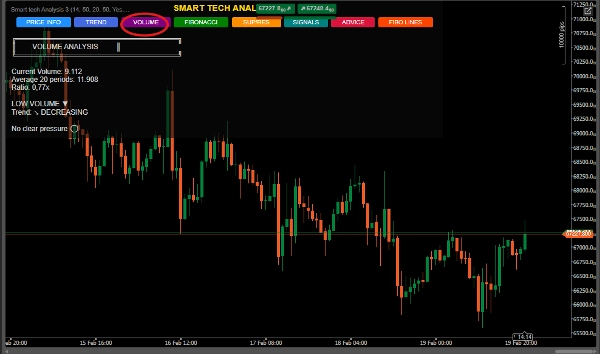
📊 4. Volume com Leitura Institucional
O sistema identifica:
Volume extremo
Pressão de compra ou venda
Aceleração ou desaceleração
Comparação com a média histórica
👉 Ideal para detectar possível atividade institucional.
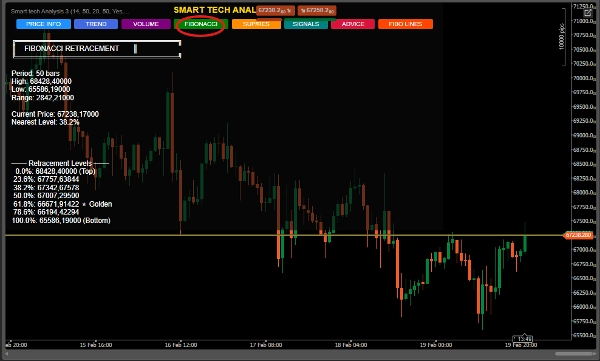
🧩 5. Fibonacci Automático com Zona Dourada
Calculado dinamicamente sobre o período definido.
Destaque especial para:
⭐ Zona 61,8% (Zona Dourada)
📌 Identificação do nível mais próximo
📌 Extensões de alta e baixa
📌 Recomendação contextual automática
Perfeito para traders de retração e swing traders.
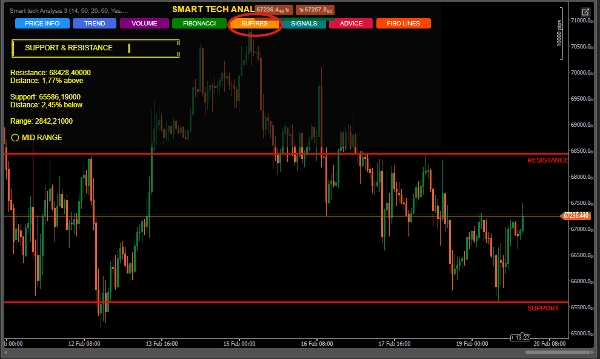
🛡 6. Suporte & Resistência Inteligentes
Detecta máximas e mínimas relevantes
Mostra distância percentual do preço atual
Classifica posição: Próximo ao suporte, resistência ou meio do intervalo
Desenha linhas automáticas no gráfico
Ideal para entrar em zonas estratégicas.
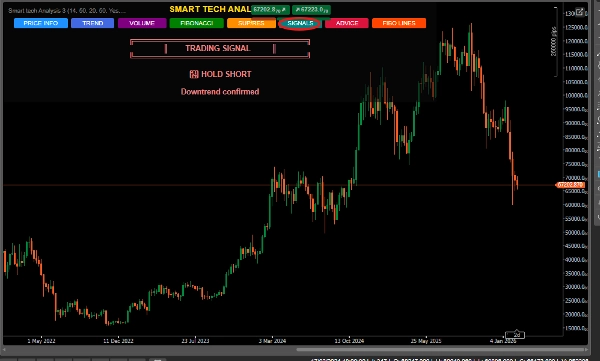
🚦 7. Sistema de Sinal de Confluência
O algoritmo não gera sinais aleatórios.
Ele combina:
✔ Cruzamento de EMA
✔ Proximidade ao suporte/resistência
✔ Estrutura da tendência
✔ Contexto de preço
Classificação:
🟢 COMPRA FORTE
🔴 VENDA FORTE
📈 MANTER LONGO
📉 MANTER CURTO
⏸ ESPERAR
Com nível de confiança indicado.
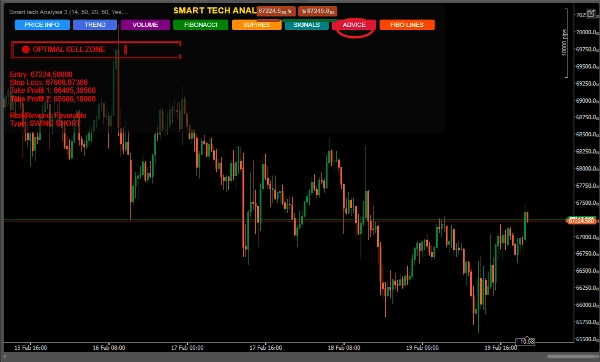
🎯 8. Recomendações com Gestão de Risco
O painel "CONSELHOS" entrega:
Entrada sugerida
Stop Loss técnico
Dois alvos de Take Profit
Estrutura de swing (Longo ou Curto)
Contexto da operação
👉 Não é apenas análise.
👉 É um plano estruturado.
🏆 Para quem é este indicador?
✔ Traders iniciantes que precisam de clareza
✔ Traders intermediários que buscam confluência
✔ Traders avançados que buscam eficiência
✔ Swing traders
✔ Scalpers que usam confirmação estrutural
💎 Por que ele se destaca no mercado? Indicadores Comuns Smart Tech Analysis
Informação Isolada Análise Integrada Poluição Visual Painel Organizado Sem Contexto Confluência Técnica Sem Gestão Stop e Alvo Sugeridos Sinais Simples Sinais com Confirmação
📊 Benefícios Diretos
✔ Reduz decisões emocionais
✔ Aumenta a precisão
✔ Melhora a leitura estrutural
✔ Economiza tempo
✔ Eleva o padrão profissional do trader
🧠 Posicionamento no Mercado
Smart Tech Analysis é ideal para:
Mercado Forex
Índices
Commodities
Criptomoedas


