present
سجل واحصل على خصم 50 دولارًا على مشترياتك الأولى
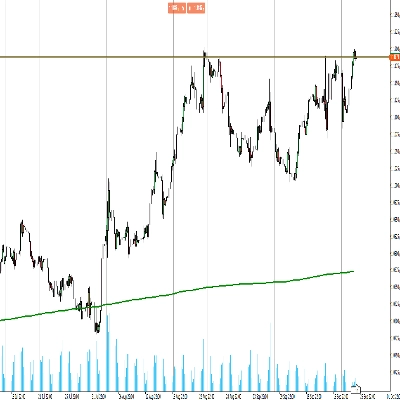
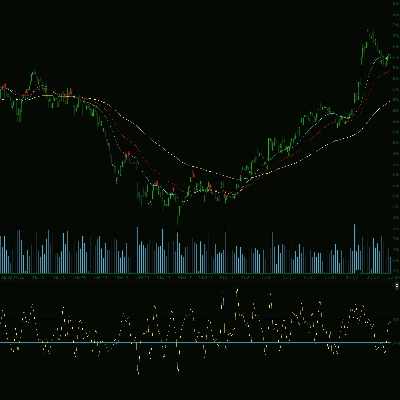
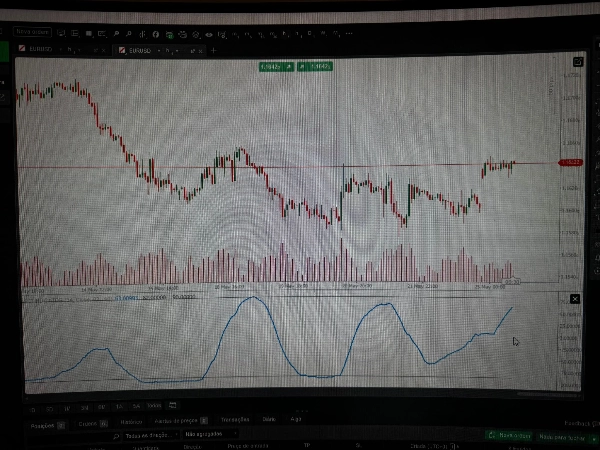
Trading product for RCI INDICATOR مؤشر Fibonacci Bollinger Bands, image 1
RCI INDICATOR
مؤشر
الإصدار 1.0، May 2026
Windows, Mac
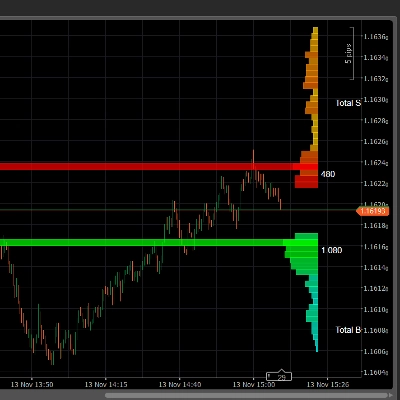
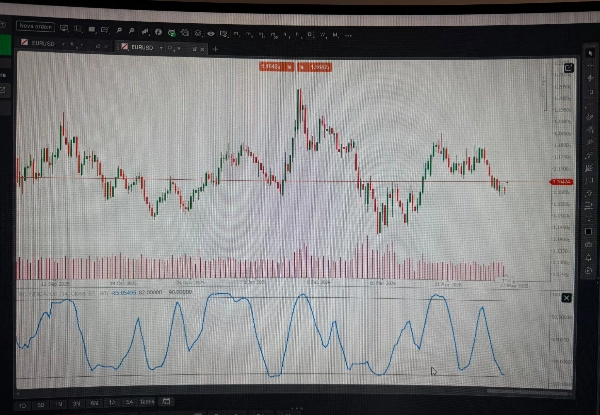
Trading product for RCI INDICATOR مؤشر Fibonacci Bollinger Bands, image 2
Trading product for RCI INDICATOR مؤشر Fibonacci Bollinger Bands, image 3
منذ 28/11/2025

الوصف

Rank Correlation Index (RCI) – Identify Trend Strength & Potential Reversals

The Rank Correlation Index (RCI) is a momentum oscillator that analyzes the correlation between price ranking and chronological ordering. The more consistently prices rise, the closer the RCI moves to +100; the more consistently they fall, the closer it moves to -100. Values near zero indicate a lack of trend or a sideways market.


The indicator analyzes:

  • RCI evaluates the consistency of price direction over a given period.
  • Unlike traditional oscillators (e.g., RSI), RCI is less sensitive to noise and better highlights trend strength.

Key parameters:

  • Period – number of bars used (default: 14 or 27).
  • Source Type – Close, Typical, Median, or Weighted price.
  • Upper/Lower levels – adjustable overbought/oversold thresholds.
  • Signal line (optional) – moving average of RCI for crossovers.

Typical use cases:

  • Trend confirmation – consistently positive/negative RCI reinforces direction.
  • Pullback entries – wait for RCI to exit extreme zones and re-enter with the main trend.
  • Exhaustion detection – extreme values + divergences hint at possible reversals.

Trader profile:

  • Suitable for day traders, swing traders, and position traders using technical analysis.
  • Appropriate for intermediate and advanced traders, but beginners can use it after studying the concept.

Notes:

  • In sideways markets, RCI may produce false crossovers – use in conjunction with trend analysis.
  • Do not use RCI alone; combine with support/resistance or other indicators.

الملخص

ملف تعريف المؤشر
فئة المؤشر
الزخم
نوع المخرجات
التصور
الإشارات
متطلبات البيانات
أعمدة السعر فقط
الإشارات المدعومة
تقاطع
التباين
قوة الاتجاه
لمس المستوى
كسر المستوى

مناقشة

تقييمات العملاء

0.0
التقييمات: 0
تقييمات العملاء
لا توجد تقييمات لهذا المنتج حتى الآن. هل جرَّبته بالفعل؟ كن أول من يخبر الآخرين!

الأسئلة الشائعة

Fibonacci
Bollinger Bands
Supertrend
Key Levels
RSI
ATR
MACD
يتم توفير المنتجات المتاحة من خلال cTrader Store، بما في ذلك روبوتات التداول والمؤشرات والإضافات، من قبل مطوري الطرف الثالث وإتاحتها لأغراض الوصول المعلوماتي والفني فقط. cTrader Store ليس وسيطًا ولا يقدم نصائح استثمارية أو توصيات شخصية أو أي ضمان للأداء المستقبلي.
قد يعجبك أيضًا

مؤشر
Prop
Forex
+10
IBS Indicator – Measures price position within bars for smarter trades. Works on all markets & timeframes.
مؤشر
ATR
Forex
+11
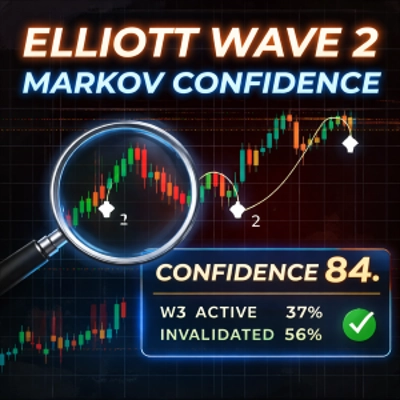
Elliott Wave 2 indicator with Markov probability analysis and a confidence score to assess Wave 3 continuation quality.
مؤشر
ADX
ATR
+2
GOLD SENTINEL v1.0 - A CANDLE-COLORING INDICATOR FOR GOLD.
مؤشر
Drawdown Monitor
Protect your funded account. Real-time Daily Equity Drawdown monitor with Green / Orange / Red flashing alerts.
مؤشر
Customize your Moving Average! Choose any timeframe and price source for precision and flexibility in your analysis.
مؤشر
AI
SMC
+13
Dynamic Liquidity Depth exposes hidden volume
مؤشر
Forex
Crypto
+6
The ultimate candlestick suite is here to help you detect most of the candlestick patters that exist today.
شعار "CHOCH BREAKOUT BLOCK"
الأعلى تقييمًا
5.0
(5)
$19
/
$30
مؤشر
SMC
BTCUSD
+9
Detects CHoCH breakouts, draws interest zones & auto Fibo. Built for Smart Money & Price Action Engulfing confirmation
مؤشر
ATR
Wedge
+2
Strong Supertrend Turn Market Movement into a Clear Map Market analysis
مؤشر
Indices
Commodities
The Advanced CCI & EMA Indicator combines the CCI with 40 & 80 EMA logic to generate precise arrows signaling direction
مؤشر
Prop
Forex
+13
Volume Meter
مؤشر
AI
SMC
+4
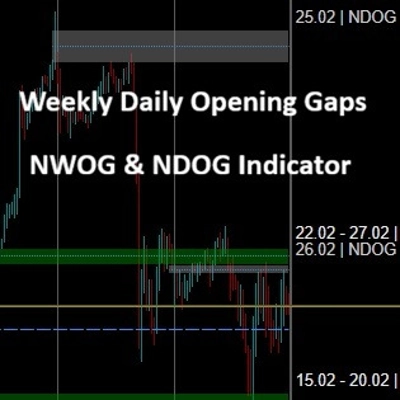
Weekly Daily Opening Gaps — NWOG & NDOG Indicator Professional-grade opening gap visualization for institutional traders
مؤشر
VWAP
Support & Resistance
Trading.FC$_vwap Algo shows VWAP trends, dynamic support/resistance and deviation bands to spot potential trade entries.
شعار "Auto Chart Patterns"
الأعلى تقييمًا
4.5
(7)
$19
/
$25
مؤشر
Prop
Forex
+13
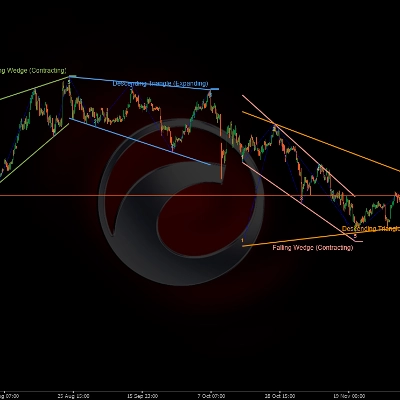
🎯Automatically detects and visualizes classical chart patterns using multi-timeframe swing point analysis.
مؤشر
RSI
XAUUSD
+2
Automatic ZigZag swings with dynamic support & resistance levels, labeling highs/lows for clear trend signals.
شعار "Dot Momentum %BB Indicator"
الأعلى تقييمًا
4.2
(4)
$19
مؤشر
RSI
Signal
+2
Dynamic circles visualize price's volatility position. Like RSI for market overextension & stretch. Quantify context.
مؤشر
Boost your trading with Candlestick Patterns for cTrader – auto-detect key signals for smarter, faster decisions!
مؤشر
AI
ATR
+10
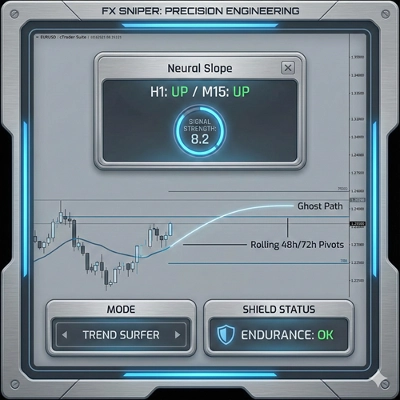
FX Sniper: Multi-pair Forex analysis tool. Features trend logic, adaptive pivots, and momentum filtering for major pairs

السعر

منذ 28/11/2025