
Descrição
Preço promocional: $500 Aproveite sua chance. O preço volta para $697 após um número definido de cópias do APEX baixadas.
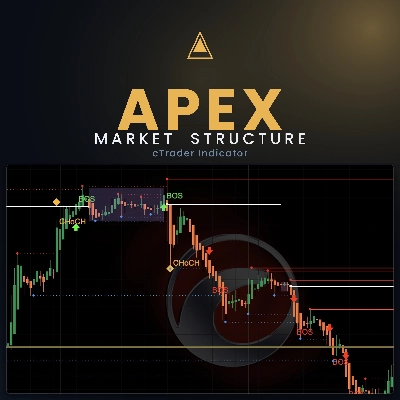
Apex Market Structure é uma sobreposição precisa e que não repinta, que mapeia a estrutura abaixo do preço em qualquer instrumento e qualquer período de tempo no cTrader. Ele lê as três fases do mercado: Contração, Expansão e Tendência, e as mostra ao vivo diante de você.
O QUE ELE ANALISA
O indicador lê a estrutura do mercado diretamente da ação do preço de barras fechadas: máximas e mínimas oscilantes (piscinas de liquidez), quebras de estrutura (BOS) e mudanças de caráter (CHoCH), períodos de compressão de volatilidade (zonas de contração, medidas pelo ATR), as fases de expansão e tendência que seguem, e o viés de tendência de períodos maiores a partir das EMAs Diária e de 4 horas. Não requer dados externos, apenas o preço no seu gráfico.
ELEMENTOS VISUAIS
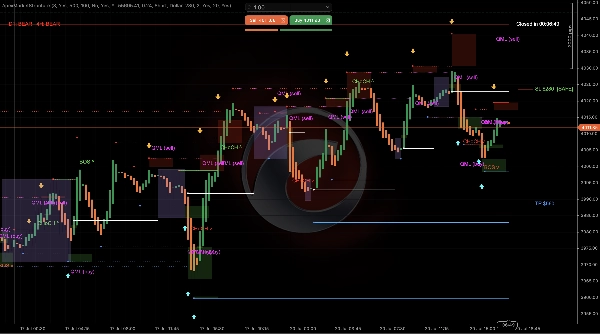
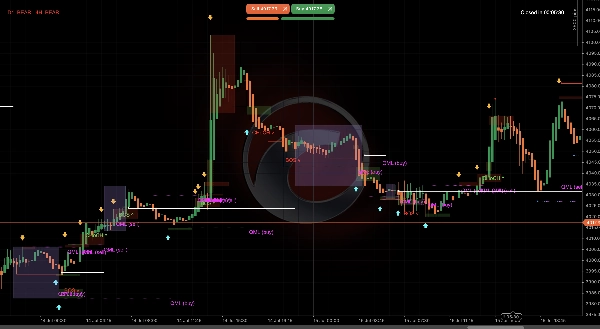
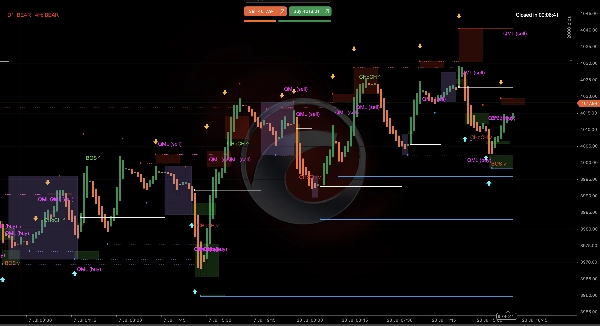
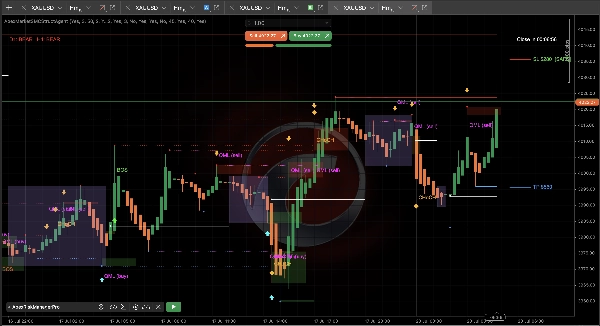
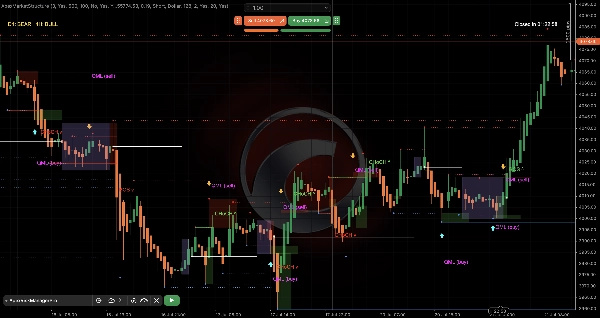
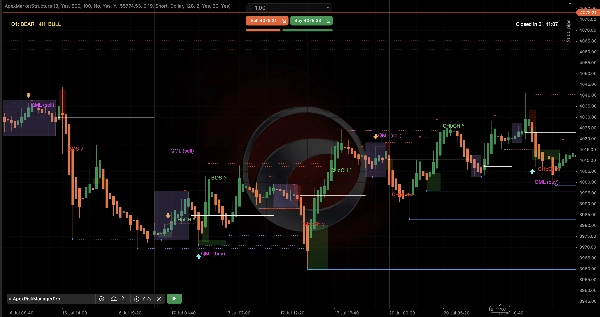
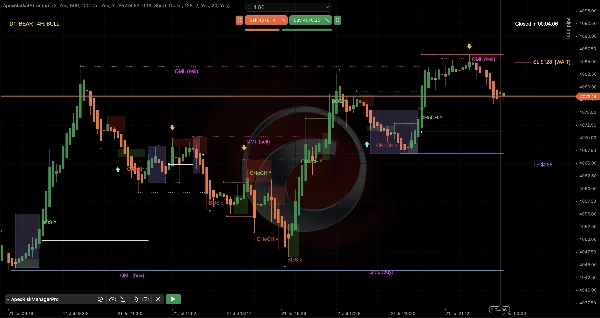
- Níveis de liquidez: máximas oscilantes (vermelho) e mínimas (azul) projetadas para frente como pools de stops em repouso. Níveis não varridos continuam se estendendo; uma vez que o preço os atinge, eles congelam e ficam pontilhados.
- Rótulos BOS / CHoCH: uma Quebra de Estrutura marca continuação; uma Mudança de Caráter marca uma possível reversão. Cada um aparece apenas em uma barra fechada confirmada.
- Setas de entrada: uma seta por quebra de estrutura confirmada, opcionalmente filtrada pelo seu viés de período maior.
- Caixas de contração: zonas preenchidas mostrando acumulação/compressão, frequentemente precedendo a expansão.
- Linha de valor (branca): um nível de referência desenhado a partir de cada contração.
- Viés HTF: uma leitura de tendência Diária + 4H mostrada em cada gráfico, mantendo as decisões de períodos menores alinhadas com o panorama maior.
- Medidor de risco pré-entrada: segmentos flutuantes de SL e TP ao lado do preço atual, dimensionados para seu saldo, tamanho de lote e risco, com um veredito SEGURO/ESPERAR medido contra o nível de liquidez não varrido mais próximo, alertando quando um stop está à frente de liquidez que o mercado ainda pode alcançar. Você tem duas opções em (%) ou moeda (USD, EUR, ...).
CONFIGURAÇÕES E PARÂMETROS PRINCIPAIS
Cada camada pode ser ativada ou desativada independentemente. Configurações ajustáveis incluem força do swing (menor e maior), contagem e espessura da linha de liquidez, período do ATR e razão de compressão, barras mínimas de contração, período da EMA de viés, modo de filtro de viés (apenas D1 / apenas H4 / ambos concordam), razão recompensa-risco, modo de risco (percentual ou dólar), e VWAP opcional, alertas (som e pop-up), pontos e uma contagem regressiva ao vivo para fechamento de barra.
CASOS DE USO TÍPICOS
- Identificar onde a liquidez institucional repousa antes de um movimento.
- Ler se o mercado está acumulando (contração), expandindo ou em tendência.
- Alinhar entradas intradiárias com a direção do período maior.
- Dimensionar uma operação e verificar a colocação do stop contra a liquidez real antes de entrar.
- Construir a disciplina para passar em um desafio de prop-firm / conta financiada.
MELHOR INDICADO PARA
Traders discricionários que usam conceitos de estrutura de mercado e smart money e querem um mapa estrutural limpo e preciso, além de dimensionamento disciplinado de risco pré-entrada. Adequado para todos os níveis de experiência, em qualquer instrumento e qualquer período de tempo, no cTrader.
LIMITAÇÕES IMPORTANTES E NOTAS DE USO
Para melhores resultados, use velas Heikin Ashi no cTrader. Este é um indicador que NÃO REPINTA: todo objeto persistente é criado apenas a partir de uma barra fechada, nunca da vela em formação ao vivo. O gráfico parece idêntico seja construído ao vivo ou recalculado ao recarregar. A compensação é que o sinal mais novo aparece uma barra após a vela que o produziu fechar, isso é intencional. O indicador é uma ferramenta de análise técnica apenas; não realiza operações e não é aconselhamento financeiro. Operar envolve risco substancial de perda, e você é responsável por suas próprias decisões de negociação. Use Apex Market Structure como seu mapa, mas lembre-se, você é o motorista.
Adições
Veja o que o mercado realmente está fazendo. Veja as 3 fases do mercado ao vivo diante de você (Fases de Contração, Expansão, Tendência) e tenha entradas melhores no estágio inicial da fase de tendência.
Pare de adivinhar. Comece a ler o mercado como as instituições, como o Smart Money faz.
Indicador Apex Market Structure para cTrader é uma ferramenta de análise smart-money precisa que elimina o ruído e mostra a verdadeira estrutura abaixo de cada vela; liquidez, mudanças de estrutura, zonas de acumulação e viés de tendência. Tudo em uma sobreposição limpa e profissional. Construído para traders sérios que estão cansados de indicadores defasados e prontos para operar com clareza.
⚠️ IMPORTANTE: Este indicador foi projetado para rodar em qualquer gráfico, mas em velas HEIKIN ASHI você terá melhor visual. Toda a análise é projetada para ajudar sua análise em um gráfico claro.
Por que os traders escolhem Apex Market Structure:
🎯 Liquidez, Exposta — Veja instantaneamente onde estão os pools de stops. A liquidez do lado vendedor e comprador é mapeada automaticamente. Observe níveis não varridos em tempo real e veja o momento exato em que o preço captura liquidez e vira. Negocie onde o smart money negocia.
📊 Estrutura que Fala — Quebras de Estrutura e Mudanças de Caráter são rotuladas no instante em que se confirmam. Saiba quando uma tendência está continuando e quando está prestes a inverter. Sem chutes, Sem repintura.
🟪 Zonas de Acumulação — Identifique a compressão antes da expansão. Apex destaca as zonas apertadas e enroladas onde grandes movimentos nascem, completas com uma linha de valor de equilíbrio.
➡️ Sinais de Entrada Claros — Marcadores nítidos e inconfundíveis disparam em eventos de estrutura confirmados. Pontos de continuação e reversão são claramente distinguidos, para que você sempre saiba o que está vendo.
🧭 Sempre Saiba o Panorama Maior — Uma leitura ao vivo do viés Diário e de 4 horas mantém você alinhado com a tendência dominante. Nunca mais fique lutando contra o período maior.
⚖️ Medidor de Risco Integrado — Uma ferramenta visual de dimensionamento pré-entrada que mapeia seu stop-loss e take-profit a partir do seu saldo, tamanho de lote e risco. Ela informa instantaneamente se seu stop está posicionado com segurança além da liquidez próxima. Funciona perfeitamente em todos os símbolos e períodos de tempo.
⏱️ Mantenha o Controle — Uma contagem regressiva ao vivo para fechamento de vela e uma exibição no gráfico mantêm você perfeitamente cronometrado e informado.
🔔 Nunca Perca um Movimento — Alertas pop-up, sonoros, push e por e-mail para cada evento chave — quebras de estrutura, varreduras de liquidez, novas zonas e entradas. Armar inteligente significa zero spam de alertas na inicialização.
O que o diferencia:
✅ 100% Não Repintável — Cada sinal trava no fechamento da vela e nunca se move. O que você vê é o que sempre esteve lá.
✅ Qualquer Mercado, Qualquer Período — Ouro, forex, índices, cripto — Apex lê todos eles.
✅ Totalmente Personalizável — Cada camada pode ser ligada ou desligada e ajustada ao seu estilo exato.
✅ Zero Confusão — Uma leitura estrutural completa, lindamente limpa.
Apex Market Structure não opera por você. Ele faz algo melhor. Ele lhe entrega a mesma clareza estrutural que traders profissionais e institucionais confiam, e devolve a decisão para onde ela pertence: a você.
Configure seu gráfico para Heikin Ashi. Adicione Apex Market Structure. Veja o mercado claramente. Tenha seu D1, H4 como seu GPS e o gatilho nos períodos menores.
"Os compradores recebem suporte e orientação contínuos para aproveitar ao máximo o Apex Market Structure na plataforma cTrade."
Resumo
The indicator visually maps liquidity levels, labels confirmed BOS and CHoCH events, highlights contraction zones with value lines, and displays entry arrows filtered by higher-timeframe bias. It includes a pre-entry risk gauge that calculates stop-loss and take-profit levels based on user balance, lot size, and risk, indicating whether stops are safely placed relative to nearby liquidity.
Users can customize settings such as swing strength, liquidity line count, ATR parameters, bias filter mode, reward-to-risk ratio, and alert options. Apex Market Structure supports all markets including forex, indices, gold, and crypto, and is optimized for use with Heikin Ashi candles for clearer visualization.
Designed for discretionary traders employing market structure and smart-money concepts, it aids in identifying institutional liquidity, market phases, and aligning entries with higher-timeframe trends while providing disciplined risk sizing and timing tools.
Avaliações de clientes
Conversa
Perguntas frequentes
Mais deste autor

Também poderá gostar de

Preço
