
Descrição
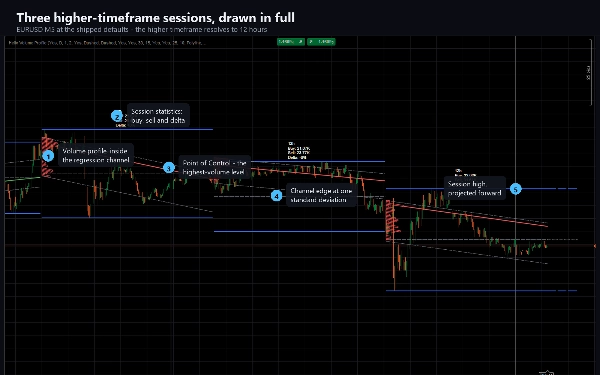
O Perfil de Volume Helix constrói uma imagem completa da sessão de timeframe superior na qual o gráfico atual está inserido.
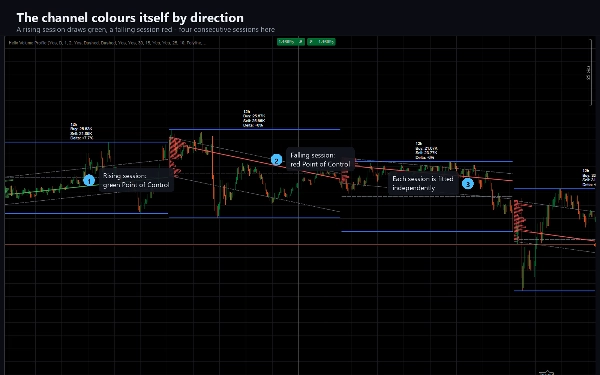
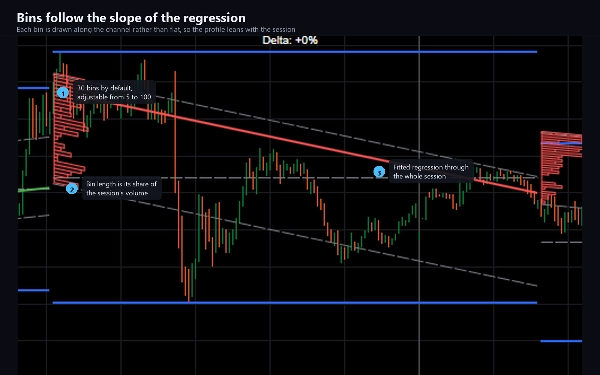
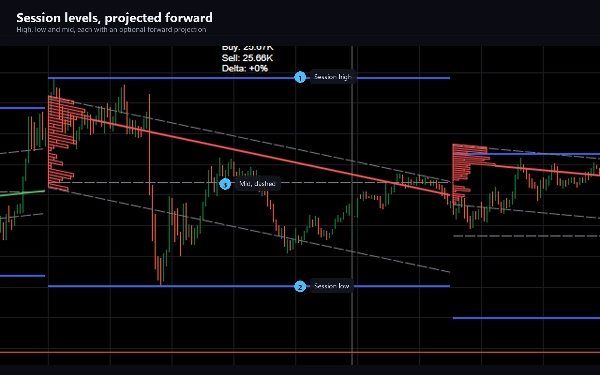
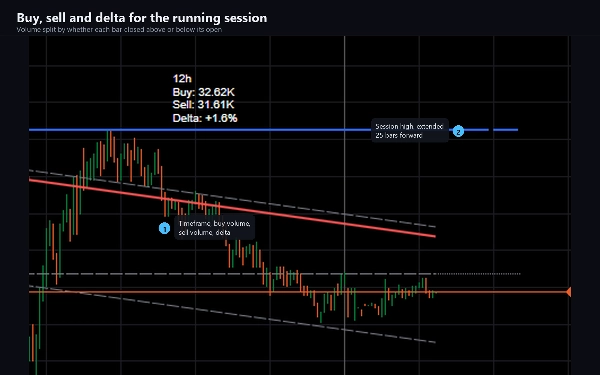
Para cada sessão, ele ajusta uma regressão logarítmica em cada barra até o momento, desenha um canal com uma largura configurável em número de desvios padrão ao redor dela e preenche esse canal com um perfil de volume cujos compartimentos seguem a inclinação da regressão em vez de ficarem planos. O compartimento de maior volume é marcado com uma linha de Ponto de Controle, colorida conforme a direção em que o canal está se movendo. Os níveis alto, baixo e médio da sessão são desenhados ao lado e podem ser projetados para frente, e um rótulo compacto informa o volume de compra, volume de venda e o delta entre eles.
O timeframe superior é escolhido para você por padrão e se adapta ao gráfico: uma sessão de 12 horas no M5, quatro horas no M1, dois dias no M15, uma semana no H1, um mês no H4. Você pode desativar isso e definir a sessão você mesmo - minutos, dias, semanas ou meses são todos aceitos.
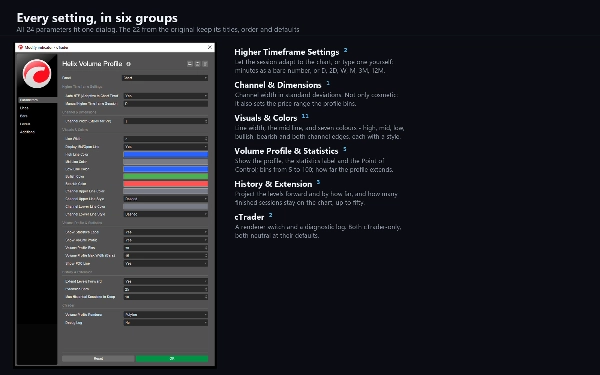
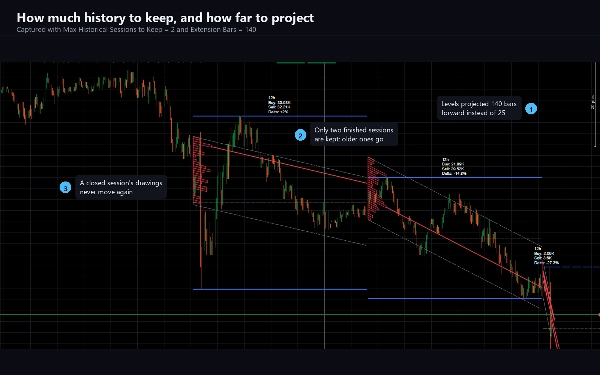
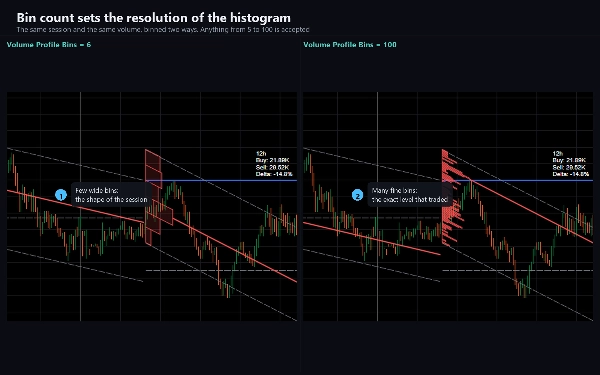
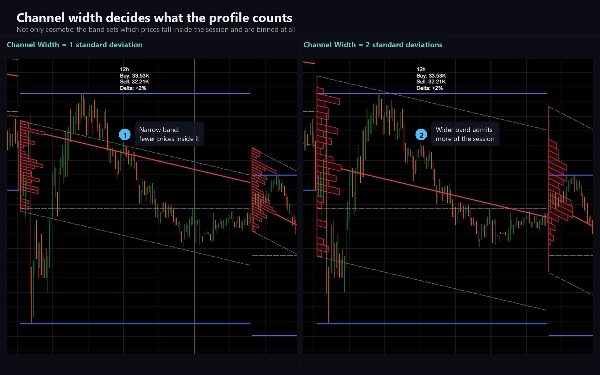
Tudo é ajustável. Largura do canal, número de compartimentos do perfil de 5 a 100, até onde o perfil se estende, se o Ponto de Controle, o rótulo de estatísticas e as projeções futuras são exibidos, as larguras e estilos das linhas, sete cores e quantas sessões finalizadas permanecem no gráfico, até cinquenta.
PARA QUE SERVE
Ler onde o preço está dentro de sua estrutura de timeframe superior sem sair do seu timeframe de trabalho. O canal mostra a deriva e dispersão da sessão; o perfil mostra onde o volume realmente se acumulou dentro dela; o Ponto de Controle marca o nível que teve mais atividade. Os traders usam isso para definir suportes e resistências, para julgar se um movimento está esticado em relação à sessão e para ver se a compra ou a venda dominaram.
Adequado para qualquer instrumento e qualquer timeframe. É mais informativo em gráficos intradiários de M1 a H4, onde a sessão adaptativa oferece uma janela significativa; em Diários e superiores, defina a sessão manualmente.
COMO SE COMPORTA
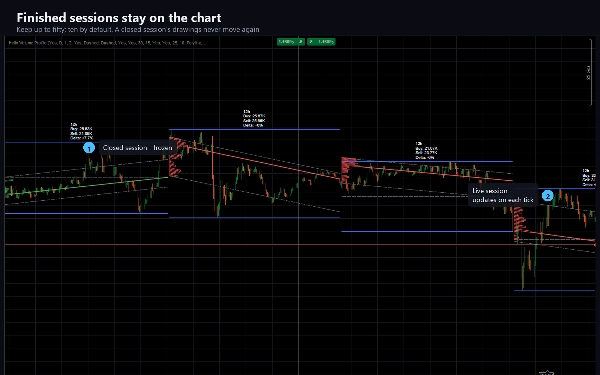
A sessão ao vivo é atualizada a cada tick e seus desenhos se movem até que a sessão se encerre - o canal é reajustado, o perfil reconstruído e os níveis reavaliados conforme cada barra chega. Uma vez que a sessão termina, seus desenhos são congelados e nunca mais mudam. Isso é intencional e é assim que o método funciona; se você precisa de níveis que nunca se movem dentro da barra, leia uma sessão fechada em vez da sessão ao vivo.
O volume em um símbolo forex é a contagem de ticks que seu corretor reporta, então o perfil reflete seu próprio feed.
TÉCNICO
Indicador, sobreposição. 24 parâmetros. Sem permissões de negociação, sem acesso a arquivos e sem acesso à rede - é construído com AccessRights definido como None e não pode fazer ordens. Inclui uma edição de teste restrita ao EURUSD sem limite de tempo e sem recursos desativados.
A documentação cobre a instalação, cada parâmetro com seu propósito e um guia de solução de problemas que explica cada comportamento que surpreende as pessoas.
Negociar envolve riscos. Desempenho passado não garante resultados futuros.
Resumo
The higher timeframe session adapts automatically based on the chart timeframe (e.g., 12 hours on M5, one week on H1) but can be manually set to minutes, days, weeks, or months. Users can customize channel width, number of volume bins (5 to 100), profile extension, visibility of elements, colors, line styles, and how many past sessions remain visible (up to 50).
The live session updates on every tick, recalculating the channel and volume profile until session close, after which the data is fixed. Volume data reflects the broker's tick count for forex symbols. Helix Volume Profile is suitable for any instrument and timeframe, with particular utility on intraday charts from M1 to H4. It includes 24 adjustable parameters and operates without trading permissions or network access.
Conversa
Avaliações de clientes
5 | 0 % | |
4 | 100 % | |
3 | 0 % | |
2 | 0 % | |
1 | 0 % |