
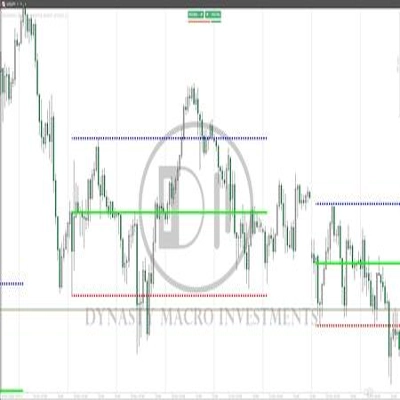
DMI MONDAY ZONES v2.1
Indicator
Version 1.0, Dec 2024
Windows, Mac
5.0
Reviews: 5

2
Sales
Description
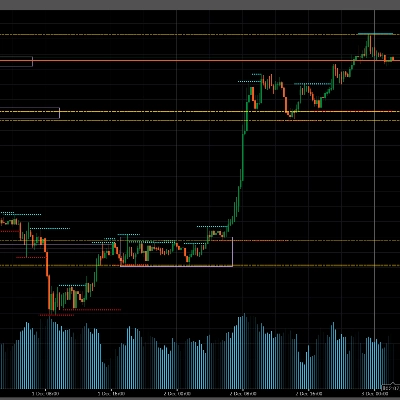
Marks Monday's OPEN,HIGH & LOW. These are areas of support and resistance for the week. You can look for continuation or reversal patterns (eg. Hammer, Engulfing, 3 Bar, Inside Bar etc.) Monday opening price. Monday High, Monday Low. Support and Resistance.
Summary
AI summary
DMI MONDAY ZONES v2.1 is a trading indicator that identifies Monday’s opening price, high, and low levels. These price points serve as key support and resistance zones for the week. Traders can use the indicator to observe potential continuation or reversal patterns, such as Hammer, Engulfing, 3 Bar, and Inside Bar formations, around these Monday price levels. The indicator helps highlight important weekly market areas to assist in technical analysis and decision-making.
Indicator profile
Discussion
Customer reviews
5.0
Reviews: 5
5 | 100 % | |
4 | 0 % | |
3 | 0 % | |
2 | 0 % | |
1 | 0 % |
Customer reviews
December 31, 2024
It helped mostly by making bad ideas easier to skip, and it can add noise if overused.
December 29, 2024
Would not throw it on live right away, but the idea is usable. Manual review still matters.
December 23, 2024
Pretty fine as one more layer, especially in range days. One green trade proves nothing.
December 19, 2024
FAQ
Products available through cTrader Store, including trading bots, indicators and plugins, are provided by third-party developers and made available for informational and technical access purposes only. cTrader Store is not a broker and does not provide investment advice, personal recommendations or any guarantee of future performance.
More from this author





Price
2
Sales