
Описание
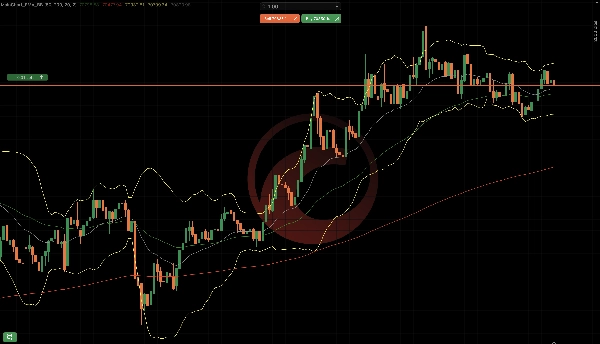
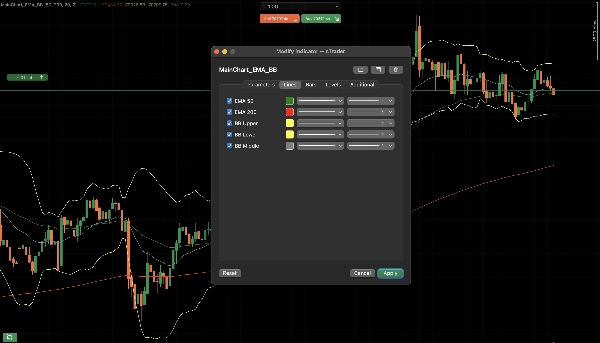
MainChart_EMA_BB является индикатором наложения на основной график для cTrader, который объединяет:
- Экспоненциальные скользящие средние (EMA 50 и EMA 200)
- Полосы Боллинджера (верхняя / средняя / нижняя)
Компоненты индикатора
Экспоненциальные скользящие средние (EMA)
Доступны две EMA:
EMAПериод по умолчаниюЦвет по умолчанию
EMA 50
50
Зеленый
EMA 200
200
Красный
Назначение:
- Направление тренда
- Динамическая поддержка/сопротивление
- EMA 50 выше EMA 200 → бычий уклон
- EMA 50 ниже EMA 200 → медвежий уклон
Полосы Боллинджера
Полосы Боллинджера состоят из:
- Верхняя полоса
- Средняя полоса (на основе EMA)
- Нижняя полоса
Настройки по умолчанию:
- Период: 20
- Стандартное отклонение: 2.0
- Тип MA: Экспоненциальный
Назначение:
- Измерение волатильности
- Зоны перекупленности / перепроданности
- Цена касается верхней полосы → возможное истощение
- Цена касается нижней полосы → возможный отскок
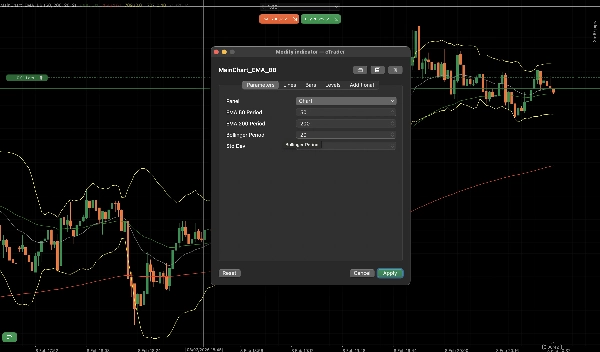
Объяснение параметров
Параметры EMA
- Показать EMA 50: Включить/выключить EMA 50
- Период EMA 50: Период расчёта
- Показать EMA 200: Включить/выключить EMA 200
- Период EMA 200: Период расчёта
Параметры полос Боллинджера
- Показать полосы Боллинджера: Включить/выключить BB
- Период BB: Период обратного отсчёта
- Стандартное отклонение BB: Множитель волатильности
Типичное использование в торговле
Подтверждение тренда
- EMA 50 выше EMA 200
- Предпочтение только длинным сделкам
Разворот / откат
- Цена откатывается к EMA 50
- Сжатие полос Боллинджера, затем расширение
Хорошо в этом индикаторе то, что он настраиваемый и нет необходимости настраивать несколько индикаторов.
Сводка
Профиль индикатора
Отзывы покупателей
4.5
Отзывы: 2
5 | 50 % | |
4 | 50 % | |
3 | 0 % | |
2 | 0 % | |
1 | 0 % |
Отзывы покупателей
February 16, 2026
a 1R exit plan makes review easier, and messy areas become easier to avoid.
February 15, 2026
Обсуждение
Частые вопросы
Prop
Forex
Indices
Commodities
Crypto
Stocks
Bollinger
Продукты, доступные в cTrader Store, включая торговых ботов, индикаторы и плагины, предоставляются сторонними разработчиками и доступны исключительно в информационных и технических целях. cTrader Store не является брокером и не предоставляет инвестиционные консультации, персональные рекомендации или какие-либо гарантии будущей доходности.
Больше от этого автора


Цена
С 01/04/2025