

Описание
ИДЕЯ
Канал Дончиана, который добавляет контекст диапазона более высокого таймфрейма вместо того, чтобы рассматривать каждый пробой изолированно.
ПРОБЛЕМА
Стандартный канал Дончиана показывает, когда цена достигает недавнего экстремума.
Но пробой не происходит в изоляции.
Пробой на M15 может быть значительным — или это может быть просто движение цены внутри гораздо большего дневного или недельного диапазона.
Таким образом, один и тот же пробой может иметь очень разный контекст в зависимости от того, где он происходит внутри диапазона более высокого таймфрейма.
Канал показывает пробой. Но сам по себе канал не показывает, где этот пробой находится внутри большего диапазона.
ОСНОВНАЯ ИДЕЯ: КАНАЛ ПОКАЗЫВАЕТ ДВИЖЕНИЕ. БОЛЕЕ ВЫСОКИЙ ТАЙМФРЕЙМ ПОКАЗЫВАЕТ, ГДЕ ОНО ПРОИСХОДИТ.
Пробой — это не только событие.
У него также есть местоположение.
Два пробоя могут выглядеть одинаково на таймфрейме исполнения, но происходить в очень разных позициях внутри диапазона более высокого таймфрейма.
Один может происходить ближе к середине большего диапазона.
Другой может происходить непосредственно внутри его верхней границы.
Ценовое движение может выглядеть одинаково.
Контекст — нет.
Этот индикатор делает этот контекст видимым, размещая предыдущий завершённый диапазон более высокого таймфрейма непосредственно на вашем текущем графике.
Вместо того, чтобы спрашивать только:
"Цена пробила канал?"
вы также можете спросить:
"Где произошёл пробой?"
ЧТО ОН ДЕЛАЕТ
Канал Дончиана с контекстом таймфрейма объединяет два слоя информации на одном графике:
1. Канал Дончиана текущего таймфрейма
Стандартный канал Дончиана отслеживает недавний максимум, минимум и середину текущего рынка.
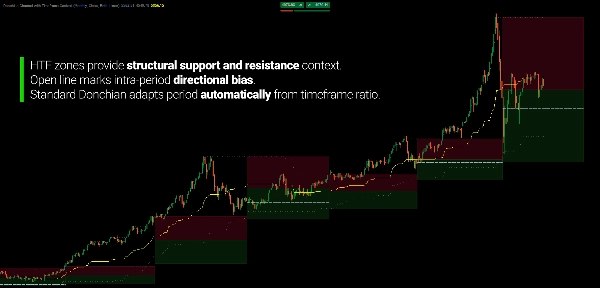
Его период рассчитывается автоматически из соотношения между таймфреймом вашего графика и выбранным контекстным таймфреймом. Например, недельный контекст на графике H1 даёт 120 баров для просмотра назад.
Вам не нужно решать, должен ли канал использовать 20, 50 или 100 баров.
Отношение таймфреймов определяет период просмотра назад.
2. Контекст более высокого таймфрейма
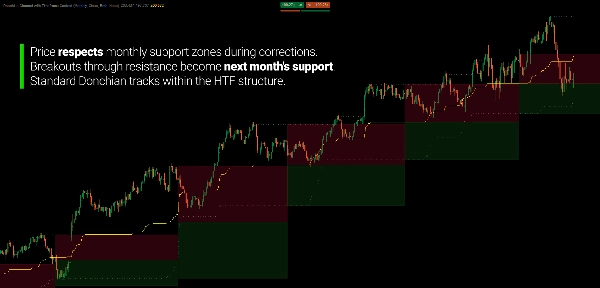
Диапазон предыдущего завершённого периода более высокого таймфрейма проецируется вперёд на ваш текущий график в виде зон поддержки и сопротивления.
Его диапазон разделён на две области:
Зона поддержки
От минимума предыдущего периода до его середины.
Зона сопротивления
От середины до максимума предыдущего периода.
По мере развития цены на вашем текущем таймфрейме вы можете сразу видеть её положение внутри этого большего диапазона.
ДВА ТАЙМФРЕЙМА. ОДИН ГРАФИК.
Канал Дончиана текущего таймфрейма показывает движение, развивающееся вокруг недавних экстремумов.
Диапазон более высокого таймфрейма предоставляет более широкую референсную рамку.
Например:
Недельный контекст → график H1
или
Дневной контекст → график M5
Нижний таймфрейм остаётся активным движением.
Верхний таймфрейм просто предоставляет окружающий диапазон.
Канал показывает, что делает цена. Более высокий таймфрейм показывает, где это происходит.
БОЛЕЕ ВЫСОКИЙ ТАЙМФРЕЙМ НЕ ПЕРЕКРЫВАЕТ НИЖНИЙ
Диапазон более высокого таймфрейма не является сигналом, указывающим, что цена должна делать.
Это референсная рамка.
Пробой на нижнем таймфрейме может продолжаться через сопротивление более высокого таймфрейма.
Откат может остановиться внутри поддержки более высокого таймфрейма.
Цена также может полностью выйти за пределы предыдущего диапазона и войти в новую территорию.
Цель не в том, чтобы предсказать, какой исход произойдёт.
Цель — сделать видимым больший диапазон, пока вы наблюдаете за развитием меньшего движения.
ПУСТИТЕ КОНТЕКСТ ОБНОВЛЯТЬСЯ САМ
Зоны более высокого таймфрейма основаны на предыдущем завершённом периоде.
Когда начинается новый период более высокого таймфрейма, контекстный диапазон обновляется.
Например:
Предыдущая неделя → Текущая неделя
Максимум, минимум и середина предыдущей недели становятся ориентиром для текущей недели.
На графике H1 эти границы остаются видимыми, пока канал Дончиана текущего периода продолжает развиваться.
Таким образом, вы получаете постоянный ориентир без необходимости вручную рисовать диапазон предыдущего периода.
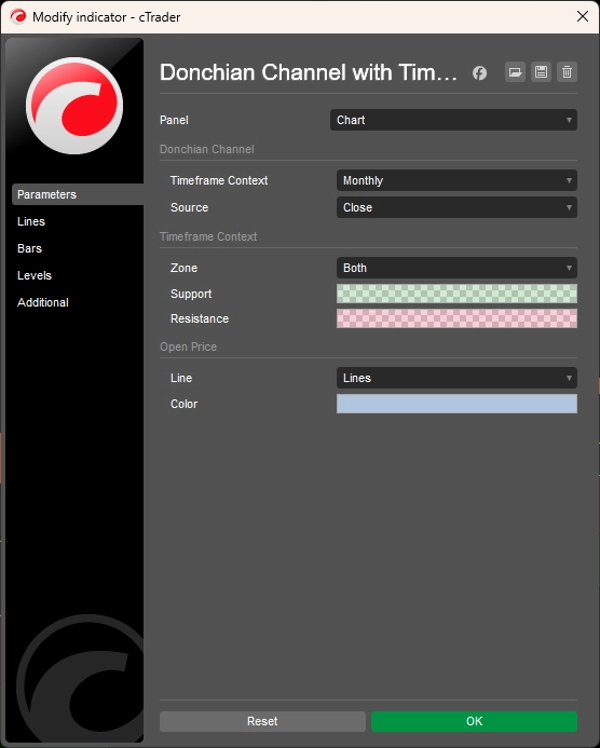
КОНТЕКСТ ТАЙМФРЕЙМА — ВАШ ВЫБОР
Выберите более высокий таймфрейм, который предоставляет нужный вам контекст:
- Месячный
- Недельный
- Дневной
- 4 часа
- 1 час
- 30 минут
- 15 минут
- И другие поддерживаемые комбинации
Индикатор автоматически обрабатывает соответствующий период Дончиана.
Вы выбираете контекст. Расчёт адаптируется к нему.
ОПЦИОНАЛЬНАЯ ССЫЛКА НА ЦЕНУ ОТКРЫТИЯ
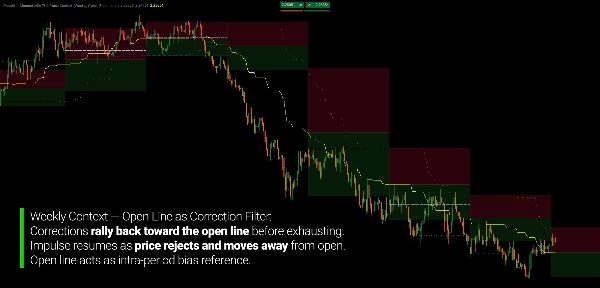
Также можно отображать цену открытия текущего периода более высокого таймфрейма.
Это даёт ещё одну точку отсчёта, где цена торгуется относительно цены открытия текущего периода более высокого таймфрейма.
Включайте её, когда хотите дополнительный контекст.
Скрывайте, когда хотите сосредоточиться на двух слоях Дончиана.
ВЫБЕРИТЕ, КАК РАССЧИТЫВАЕТСЯ КАНАЛ
Границы Дончиана могут рассчитываться на основе:
Закрытия
или
Максимума / Минимума
Расчёт на основе закрытия даёт границы по ценам закрытия.
Расчёт по максимуму/минимуму включает полные экстремумы теней и, следовательно, представляет более широкий ценовой диапазон.
Выбор источника применяется последовательно как к расчётам текущего таймфрейма, так и к более высокого.
РАЗРАБОТАН ДЛЯ КОНТЕКСТА, А НЕ ДЛЯ ПОГОНЯ ЗА СИГНАЛАМИ
Канал Дончиана с контекстом таймфрейма не является системой предсказания пробоев.
Он не говорит вам, удастся ли пробой.
Он даёт вам определённую среду, в которой можно его наблюдать.
Используйте его для изучения:
- Пробоев
- Откатов
- Границ более высокого таймфрейма
- Позиции внутри большего диапазона
- Расширения за пределы предыдущих экстремумов
- Геометрии цены на нескольких таймфреймах
- Текущего движения относительно предыдущего периода
Стандартный канал Дончиана показывает, где находятся текущие экстремумы.
Контекст более высокого таймфрейма показывает, где эти экстремумы находятся внутри большего диапазона.
КЛЮЧЕВЫЕ ОСОБЕННОСТИ
- Стандартный канал Дончиана
- Автоматический расчёт периода текущего таймфрейма
- Проекция диапазона более высокого таймфрейма
- Зоны поддержки и сопротивления в контексте
- Максимум, минимум и середина предыдущего периода
- 13 выбираемых контекстов таймфрейма, от месячного до 15 минут
- Опциональная цена открытия более высокого таймфрейма
- Режимы расчёта по закрытию или максимуму/минимуму
- Настраиваемое отображение зон: обе, только поддержка, только сопротивление или нет
- Опции отображения только поддержки / только сопротивления
- Обновления в реальном времени
- Поддержка временных и нетиповых графиков, включая тиковые, Ренко и диапазонные
---
Торговля связана с риском. Этот индикатор является инструментом технического анализа и должен использоваться вместе с соответствующим управлением рисками.
Сводка
This dual-layer system automatically adapts the Donchian lookback period based on the ratio between the selected higher timeframe and the chart timeframe, eliminating manual period settings. It supports 13 timeframe options from Monthly to 15 Minutes and can be applied across various markets including forex pairs (EURUSD, GBPUSD, USDJPY, NZDUSD), commodities (XAUUSD), indices (NAS100), and cryptocurrencies (BTCUSD).
Key features include real-time updates of both standard and higher-timeframe channels, configurable visual zones with adjustable colors and transparency, an optional open price line marking the higher-timeframe period’s open, and flexible price source settings (close or high/low).
The indicator aids traders in filtering false breakouts by showing whether price movements occur within structural supply or demand zones on a higher timeframe. It is designed for trend-following, swing, and discretionary traders who use Donchian channels and seek enhanced structural context to better assess breakout significance and correction exhaustion without switching timeframes.
Отзывы покупателей
Обсуждение
Частые вопросы
























Цена